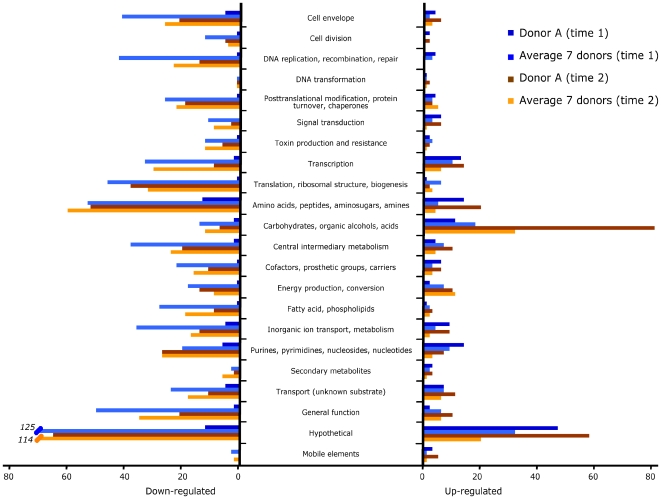
Figure 3. Differential regulation of transcript expression in GBS strain NEM316 after incubation with human blood.
Genes were classified into 22 main functional categories. Bars indicate the numbers of genes whose expression was modified in the donor A blood sample and the average of the seven other donor blood samples at time 1 and time 2 relative to time 0. On the left, genes that were down-regulated relative to time 0. After 30 min of incubation, 62 transcripts were down-regulated in the donor A blood sample, while 658 transcripts were down-regulated in the other donor blood samples. After 90 min of incubation, 369 transcripts were down-regulated in the donor A blood sample, while 518 transcripts were down-regulated in the other donor blood samples. On the right, genes that were up-regulated relative to time 0. After 30 min of incubation, 160 transcripts were up-regulated in the donor A blood sample, while 134 transcripts were up-regulated in the other donor blood samples. After 90 min of incubation, 270 transcripts were up-regulated in the donor A blood sample, while 115 transcripts were up-regulated in the other donor blood samples.

