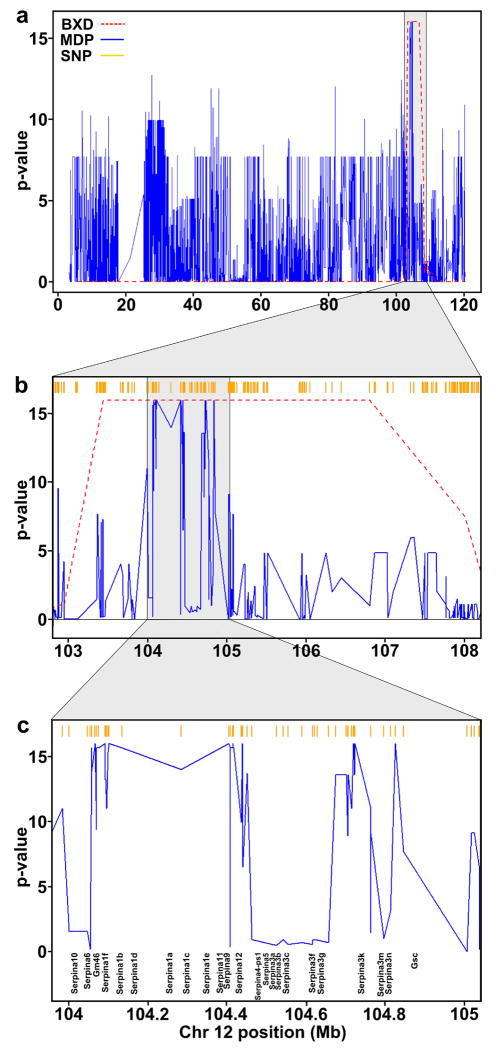
Figure 2.
Reduction in eQTL hotspot width using laboratory inbred strains. Panel (a) shows the eQTL profile on Chr 12 for the BXD strains (red) and the laboratory inbred strains (black) using Fisher's combined method to aggregate the p-values of all transcripts that have a significant QTL at this locus in each panel. SNP density in the 156K data is shown in orange. Panels (b) & (c) show successively zoomed in regions of the hotspot and demonstrate the narrower eQTL interval produced by the inbred strains.

