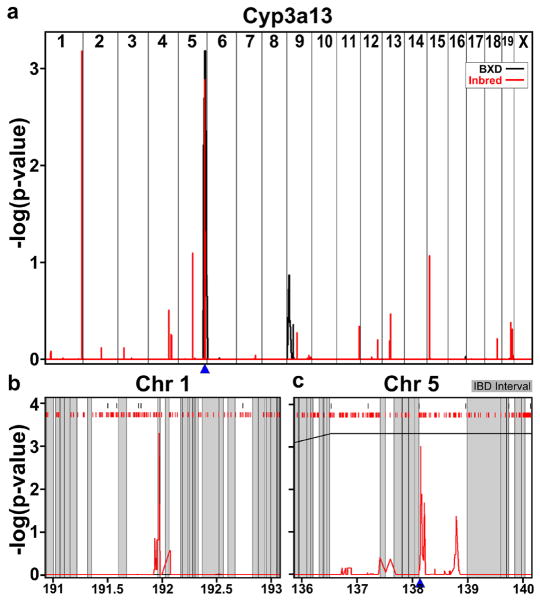
Figure 4.
a) Cyp3a13 QTL plot with the BXD p-values in black and the laboratory inbred p-values in red. Cyp3a13 location is shown by the blue triangle. b) Cyp3a13 QTL plot on Chr 1 with IBD intervals between C57BL/6J and DBA/2J shaded in grey, BXD markers along the top in black, laboratory inbred markers in red. c) Cyp3a13 QTL plot on Chr5.

