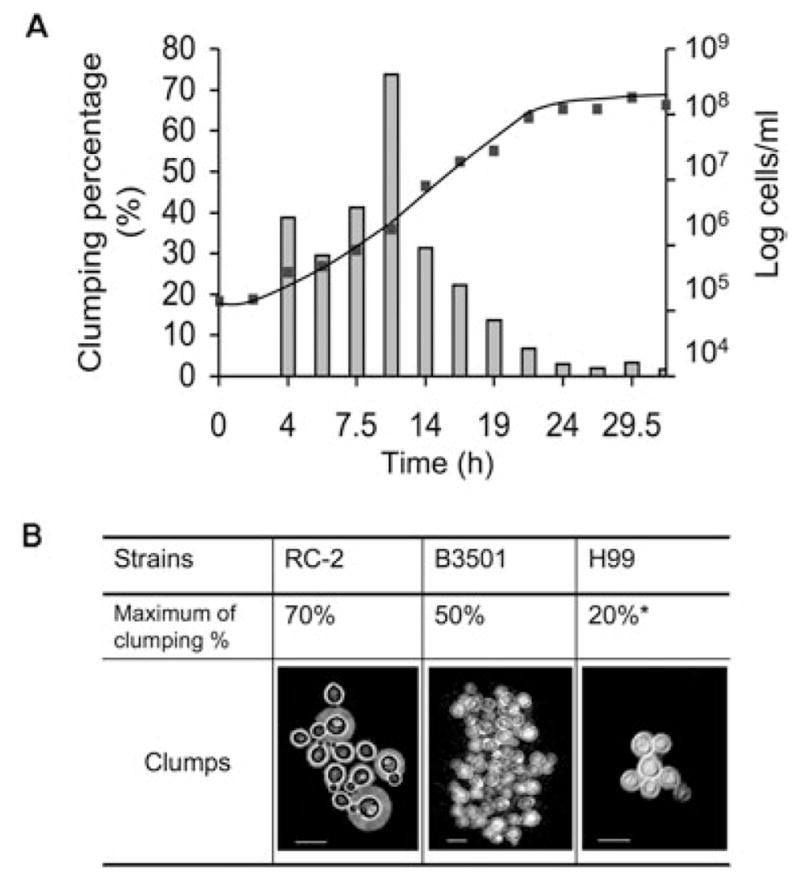
Fig. 1.

A. Growth curve (line) and cell aggregation (column) of RC-2. The culture was grown with a starting inoculum of 105 cells ml−1 in SAB broth. The number of cells at each specific time interval was counted on a haemocytometer.
B. Cell aggregation of C. neoformans strains grown in SAB broth. *Cells cultured in SD medium. Scale bar, 10 μm.
