
Figure 5.
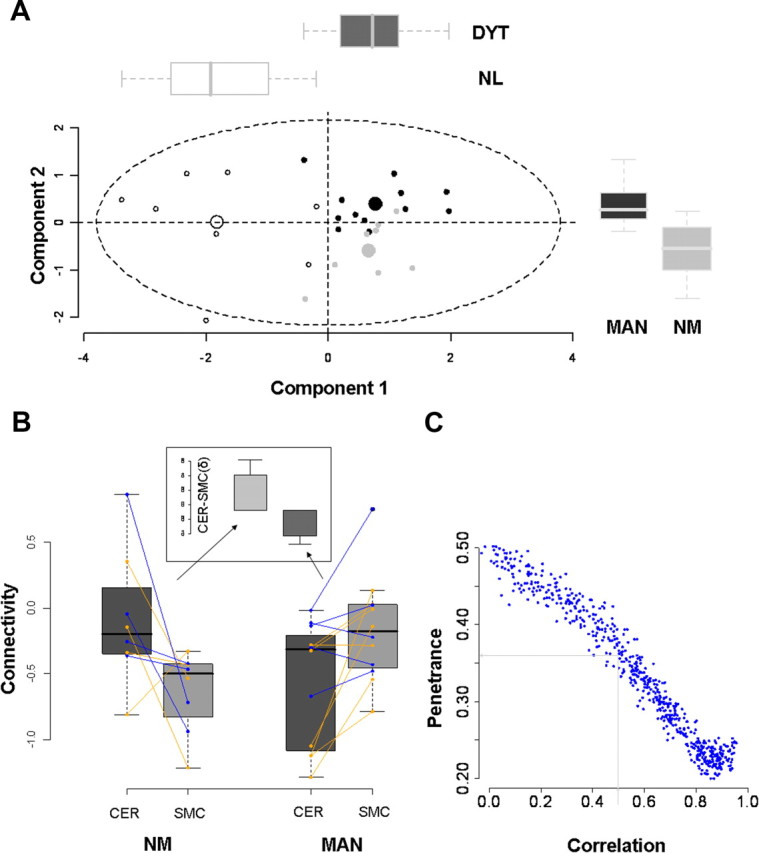
Penetrance is determined by connectivity changes at proximal and distal sites. A, PLS-DA was used to classify individual mutation carriers as penetrant or nonpenetrant based on their measured connectivity at the four loci described above (Fig. 1, clusters a1, b1, c2, and d1). Two significant discriminant functions accurately categorized the subjects. Component 1 (x-axis) separated the dystonia gene carriers (DYT, n = 20) from NL subjects (n = 8) (p < 0.00001; Mann–Whitney U test). Component 2 discriminated MAN (n = 12) from NM (n = 8) (p = 0.002, Mann–Whitney U test). The distribution of subject scores on the two discriminant functions was similar for both genotypic subgroups. [See supplemental Fig. 4, available at www.jneurosci.org as supplemental material, for validation of the PLS-DA results and for the regional loadings of the two discriminant functions.] B, Box-and-whisker plots showing the connectivity values for the cerebellar (CER) and SMC clusters from the individual gene carriers. For each subject, z-transformed connectivity values for each region were right-left averaged and connected by lines (DYT1, orange; DYT6, blue). Subject differences in connectivity between regions (δ = CER − SMC; inset) were compared for the MAN and NM carriers. Differences in δ were found to be significant (p = 0.001, Mann–Whitney U test), with positive values for the NM group and negative values for the MAN group. C, Monte Carlo simulations predicting the penetrance rate in dystonia gene carriers based on randomly chosen connectivity values for the proximal and distal CbTC pathway segments. Different values were assumed (x-axis) for the correlation coefficient relating the two connectivity measures. (The details of this model and its assumptions are presented in Materials and Methods). A correlation coefficient of 0.56, based on the regression analysis of DYT1 carrier and control data (SMC = a · CER + b: a = 0.52, b = 0.12; r = 0.56, p = 0.01, n = 19), predicted a penetrance rate of ∼36% (see Results).