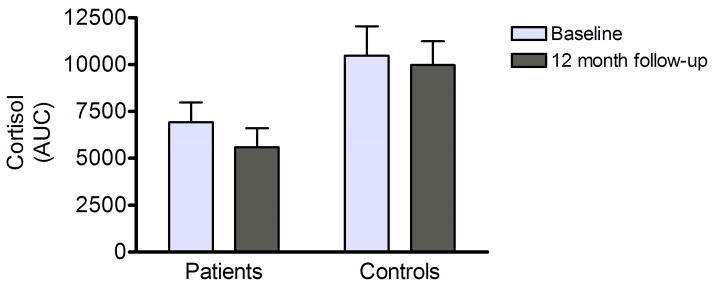
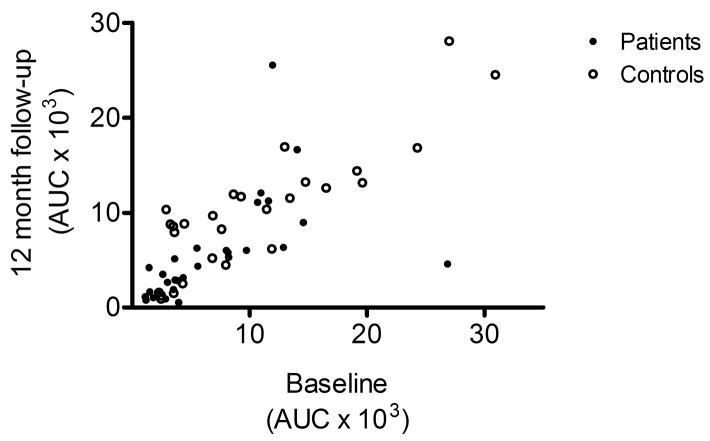
Figure 2.
A) Comparison of cortisol responses measured as AUC indicated high stability between the baseline assessment and the 12-month follow-up reported here. Responses for patients and controls, respectively, are given (mean ± SEM). On a repeated measures analysis across the two rounds of testing, there was a significant main main effect of group (p=0.02), but no time effect, or group × time interaction. For details and statistics, see Results.
B) Cortisol responses also showed high individual stability, as shown by a highly significant correlation between the baseline and the present follow-up study (R=0.76, p≪0.0001).


