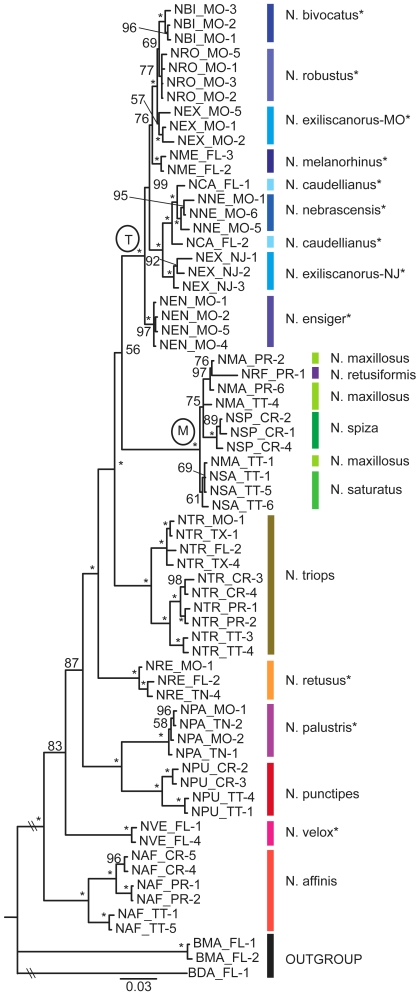
Figure 4. Phylogeny of Neoconocephalus based on the combined analysis of the nuclear and mitochondrial genes.
Bayesian phylogeny of Neoconocephalus using the combined H3, ITS and COI data sets. Nodal support values are given as posterior probabilities in percent; asterisk indicate 100%. The temperate clade and the N. maxillosus clade are indicated by labels ‘T’ and ‘M’, respectively. Branch lengths drawn to scale. The taxa included in this tree are listed in Table S1. Asterisks at the species names indicates temperate life history. Species are indicated by colored lines.

