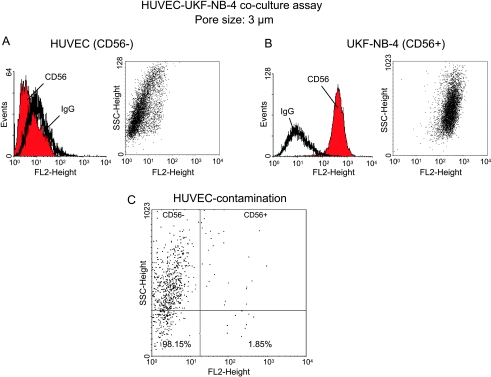
Figure 1.
Fluorometric analysis of CD56 surface expression on HUVECs (A) versus UKF-NB-4 cells (B). Both cell types were stained separately with PE-conjugated monoclonal antibody anti-CD56, which detects the NCAM 120-, 140-, and 180-kDa isoforms. CD56 expression is depicted as dot blot (sideward scatter vs CD56) and FL-2H (log) channel histogram analysis. (C) A 24-hour contamination rate of CD56- HUVEC by traversed CD56+ UKF-NB-4 cells in the transwell coculture assay. Cell populations growing on the upper surface of 8-µm pore-sized membranes were stained with an anti-CD56 monoclonal antibody and dot blot analysis carried out by a FACscan. One representative of three tests is shown.

