
Figure 3.
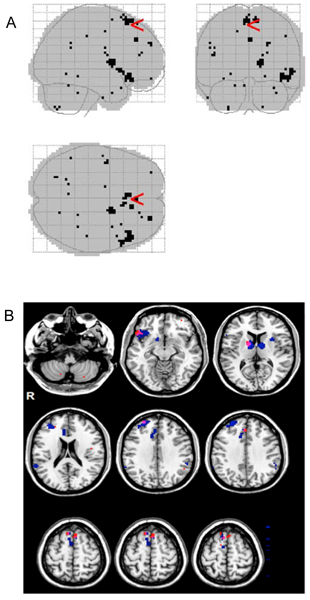
The anatomic locations of the selection features. (A) The 124 selected features from the ensemble method were mapped back to the brain volume. (B) Overlay of the selected features to the regions identified by group-wise statistical analysis. The 124 selected features from the ensemble method were mapped to the brain regions identified by group-wise statistical test. In the figure, the 124 selected features are marked with the red color and the regions identified by group-wise statistical test are marked with the blue color.