Figure 4.

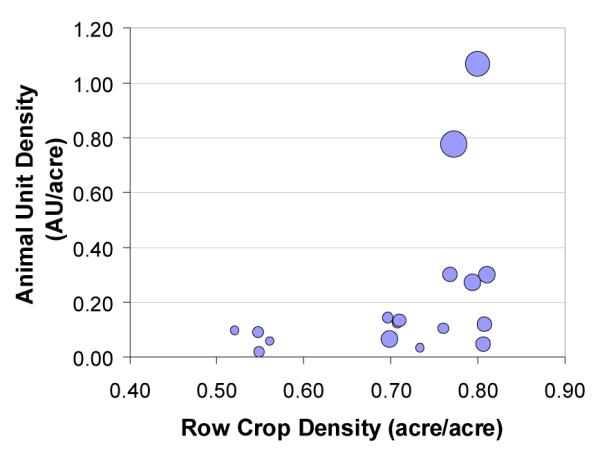
Nitrate concentration (mg/l) shown as bubble size for 17 independent EISA monitoring stations. The smallest point represents 6.35 mg/l. The largest point represents 15.8 mg/l.

Nitrate concentration (mg/l) shown as bubble size for 17 independent EISA monitoring stations. The smallest point represents 6.35 mg/l. The largest point represents 15.8 mg/l.