Figure 1.
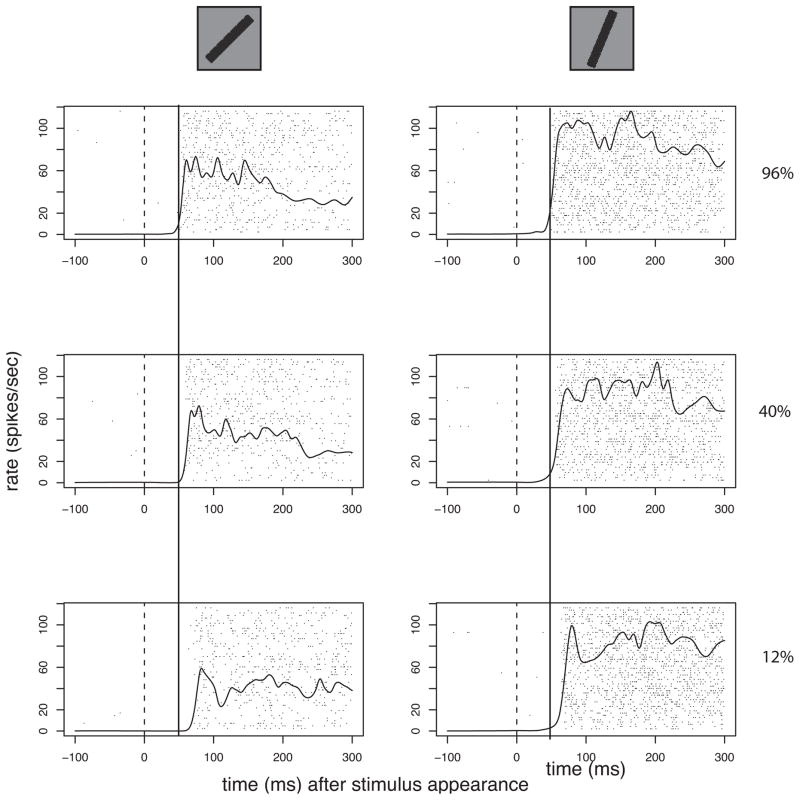
Orientation and contrast affect two different parameters in supragranular V1 neuronal responses from rhesus monkey. The oriented bar at the top represents the stimulus flashed onto the receptive field of this neuron. The average number of spikes during the stimulus presentation changes with the orientation. As this example shows, the latency to response onset is closely related to the contrast. This example shows that the latency and average response strength can be independent, or nearly so. Thus, one important aspect of temporal coding, latency to response onset conveys, or at least emphasizes, different information than that conveyed by spike count. This example also demonstrates that counting spikes with respect to a fixed reference for all examples might induce a correlation with contrast that is really due to the delay in the response onset for lower contrast stimuli. For the rasters each line of dots shows the time of an action potential with reference to the stimulus appearance (vertical line at 0). The continuous line is a spike density plot formed by the convolution of a Gaussian pulse (σ = 3ms), converted to spikes/second/trial. The orientations of the two black bars are shown at the top of each column, and the luminance contrast is on the right of each row. This neuron shows the almost total absence of activity when there is no stimulus on the receptive field (to the left of time = 0).

