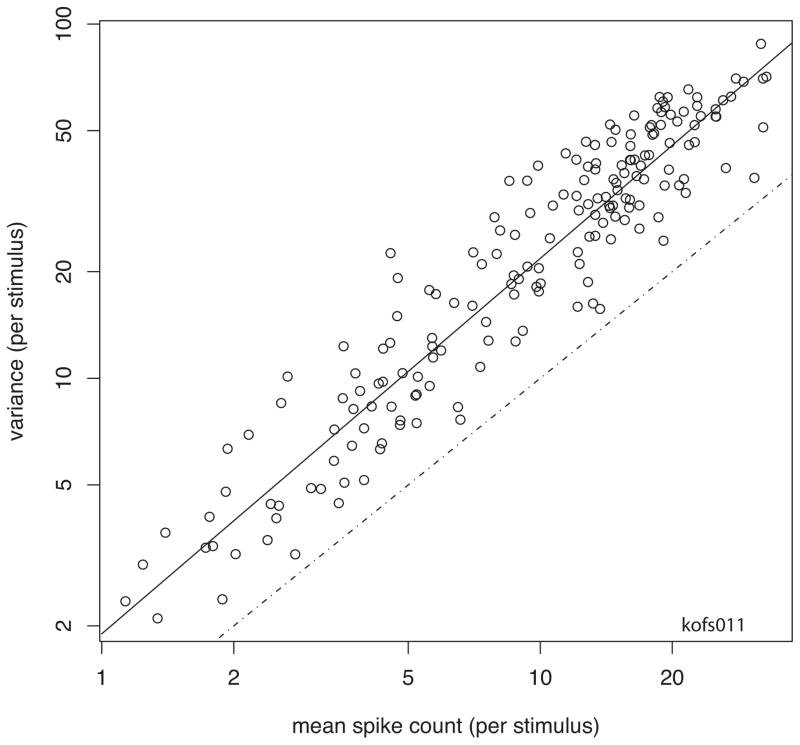
Figure 3.
Variance of spike count as a function of spike count for 174 stimuli from one supragranular V1 neuron. On this log-log plot, the variance is linearly related (solid line) to the spike count. The relation here is ‘supra’ Poisson, that is, the regression line is offset above the line for which the variance equals the mean, which usually indicates some type of bursting. The stimulus set consisted of black bars, white bars, Walsh patterns, and speckled bars (cf Figure 2). All of the stimuli were presented, then the order was shuffled and they were presented again, for about 50 times (if the monkey broke fixation, which happened rarely, the response was not used here).

