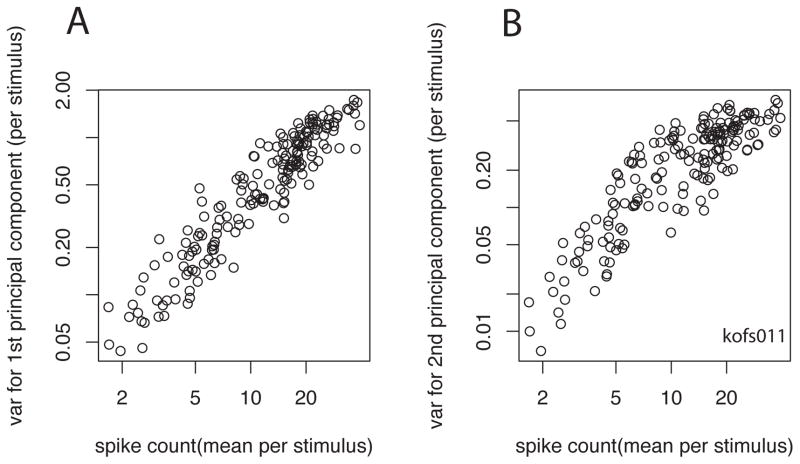
Figure 5.
Mean variance relations between spike counts for each of the 174 stimuli (x-axis) and variance of 1st (left panel) or 2nd principal components for the corresponding stimulus. This shows that the variance of the coefficients of the 2nd principal component is linearly related to the mean spike counts, just as is true for the spike count variance and 1st principal component variance.

