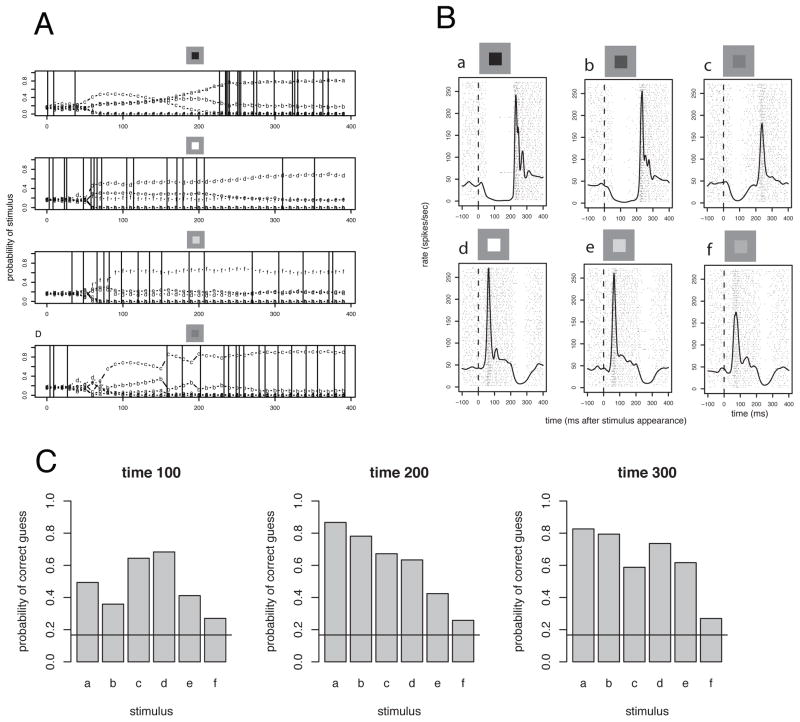
Figure 9.
Decoding examples for neurons that have ongoing activity as is often seen in monkey LGN neurons. A. Decodings for 4 example responses (chosen to end correctly). The stimuli are shown above. The vertical lines show the spike times. The lower-case letters a–g show the probability that the response seen until the time examined was elicited by each stimulus seen in panel B. The horizontal line shows the 1/6 prior probability assuming random guessing. B. The rasters and spike density for the 6 different stimuli shown in this example. These were all square spots positioned on the receptive field and flashed on for 250 ms each. Notice the off-responses. C. The decoding performance for each of the stimuli at 3 different times during the stimulus cycle. The decoding performance is different across the stimuli, and leads to the conclusion that some stimuli are more easily mistaken (misidentified) for others. Also, decoding improves with time, with the best average decoding occurring at 300 ms after stimulus appearance.

