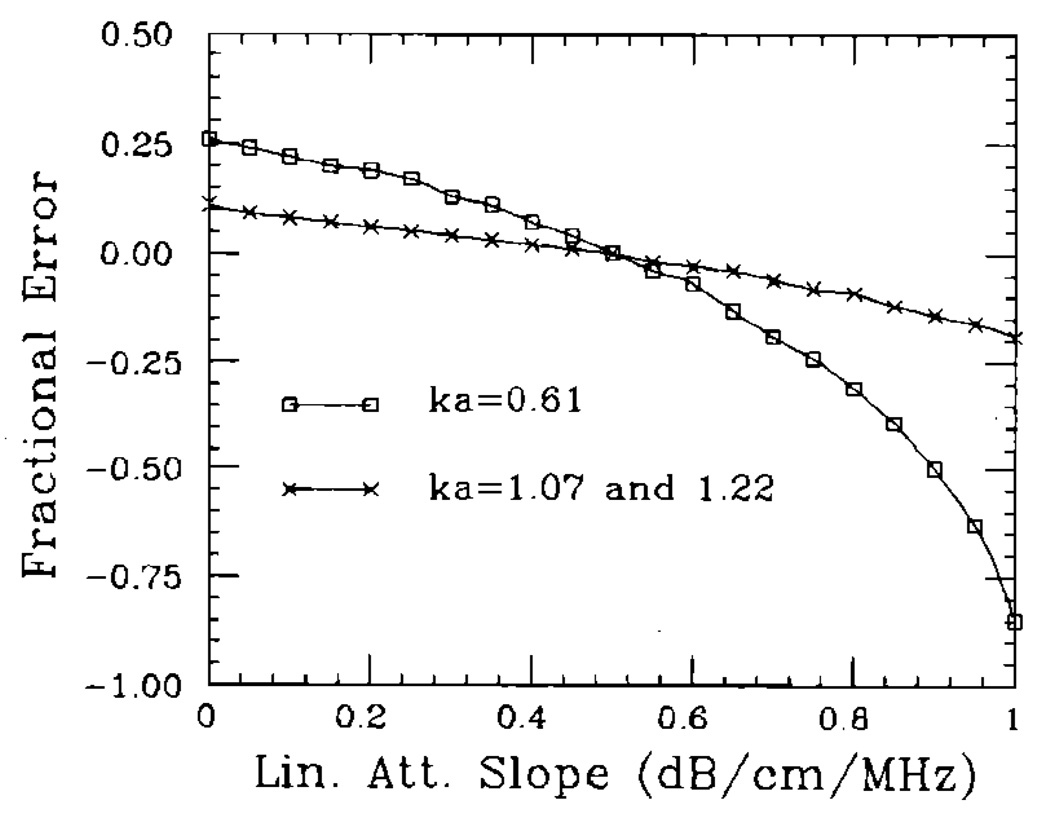
FIG. 6.
Plots of the variation in particle size estimates with an uncertainty in the linear attenuation slope estimate. The results depend on the value of ka, and span the range of attenuation values typical in soft biological tissues. The errors for ka = 1.22 and ka = 1.07 are identical. Lower values of ka give rise to larger errors.

