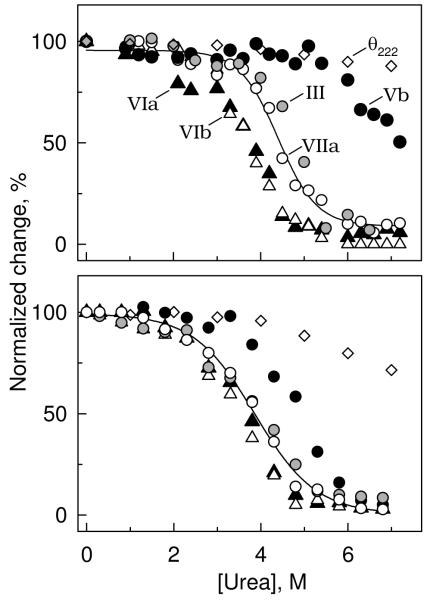
Figure 2.
Concentration dependence of urea-induced dissociation of subunits from CcO. CcO was exposed to urea (0 - 7 M), and the subunit content determined after removal of urea and dissociated subunits by HiTrap Q anion exchange column chromatography (refer to Methods for details). Data were collected after exposure of CcO to urea for either 10 min (top panel), or 2 h (bottom panel) at room temperature. Five subunits dissociated with a sigmoidal dependence upon the urea concentration: III (grey-filled circles); Vb (black-filled circles); VIa black-filled triangles); VIb (unfilled triangles); and VIIa (unfilled circles). A full complement of the other eight subunits remained associated with the core of CcO, even at the highest urea concentration. Dissociation of each subunit could be fitted by non-linear regression analysis according to equation (5). For clarity, only the best-fit line through dissociation data collected for subunit VIIa are shown. Molar ellipticity data, θ222nm (unfilled diamonds), is also included in each panel, which indicates that only minimal perturbation of the secondary structure occurs after exposure of CcO to 7 M urea for 10 min, or 4 M urea for 2 h at room temperature.

