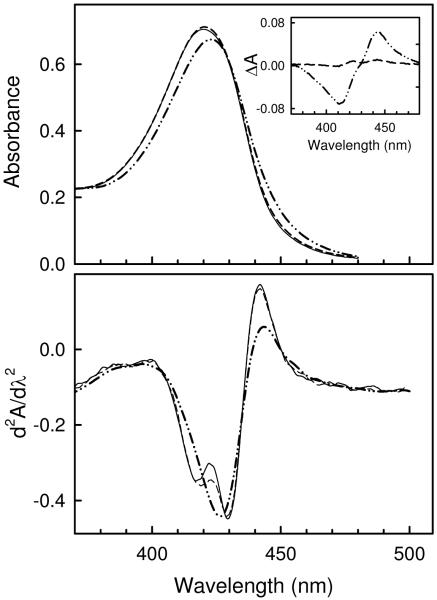
Figure 3.
Urea-induced changes in the visible spectrum of CcO. Top Panel, absorbance spectrum of CcO after exposure to 6 M urea for 0 min (solid line), 10 min (dashed line), or 120 min (dotted-dashed line). Inset, corresponding difference spectrum relative to CcO exposed to urea for 0 min. Bottom Panel, second derivative spectrum of CcO after exposure to 6 M urea at room temperature for 0 min (solid line), 10 min (dashed line), or 120 min (dotted-dashed line). In each case spectra were acquired at 25 ° after CcO was incubated in 6M for the given length of time, and subsequently diluted 5-fold with 20 mM MOPS buffer, pH 7.2, to quench the dissociation reaction.

