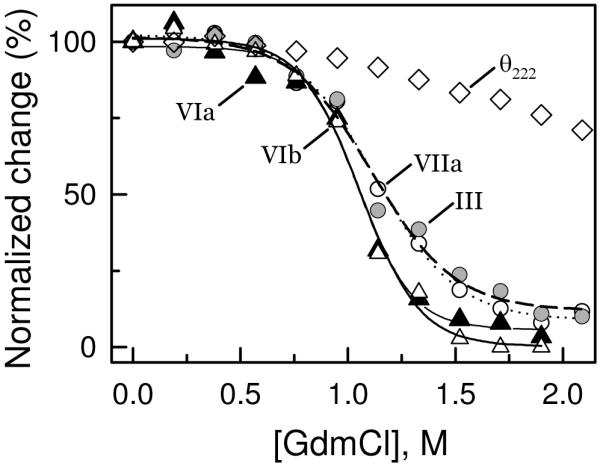
Figure 4.

Concentration dependence of GdmCl-induced dissociation of subunits from CcO. CcO was exposed to GdmCl (0 - 2.2 M), and the subunit content determined after removal of GdmCl and dissociated subunits by HiTrap Q anion exchange column chromatography (refer to Methods for details). Data were collected and analyzed as described in Figure 2 for urea-induced dissociation of subunits from CcO. Data are shown for dissociation of subunits III (grey-filled circles), VIa (solid-filled triangles), VIb (unfilled triangles), and VIIa (unfilled circles), together with accompanying changes in the molar ellipticity, θ222nm (unfilled diamonds).
