Figure 5.
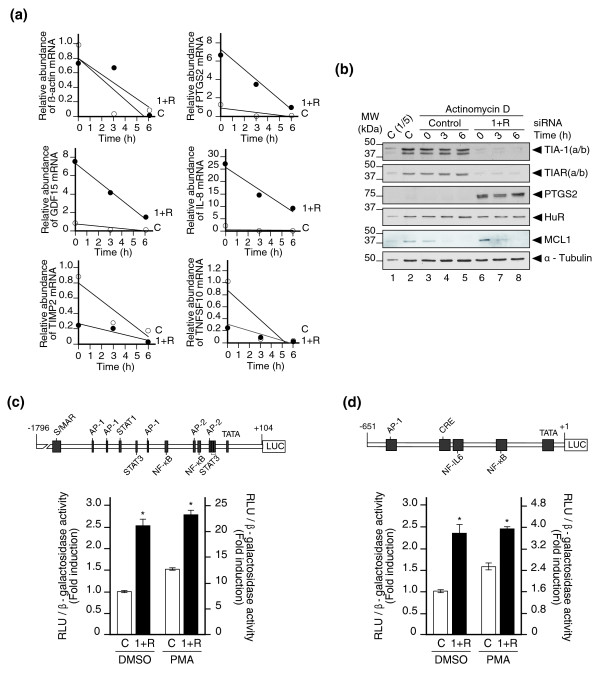
Silencing of TIA proteins alters both mRNA stability and gene transcription. (a) DNA transcription was inhibited in control and TIA-1/TIAR-depleted HeLa cells by the addition of actinomycin D (Act D; 5 μg/ml) to the culture medium. Cytoplasmic RNA was isolated at various times (0, 3 and 6 h) after the addition of the inhibitor Act D and analyzed by real time RT-PCR. Relative levels of β-actin, PTGS2, GDF15, IL-8, TIMP2 and TNFSF10 mRNAs were determined with the specific primer pairs (Additional data file 11). A representative experiment is shown. Steady-state RNA levels are represented at various times after the addition of Act D. Open and closed circles illustrate relative RNA levels in control (C) and TIA-1/TIAR (1+R)-depleted samples, respectively. (b) Validation of differential expression for selected genes by western blot analysis. Protein extracts (5 μg (lane 1; C(1/5)) or 25 μg (lanes 2 to 8)) derived from post-transfected HeLa cells with control (lanes 1 to 5) and TIA-1 and TIAR (lanes 6 to 8) siRNAs and treated with Act D as in (a) were analyzed with the indicated antibodies. A representative blot is shown. Molecular weight markers and the identities of protein bands are indicated. TIA-1(a/b) and TIAR(a/b) refer to the major isoforms of TIA-1 and TIAR, respectively. (c, d) Effect of the TIA-1/TIAR silencing on transcriptional activation of the PTGS2 (c) and IL-6 (d) gene promoters. A schematic representation of PTGS2 (c) and IL-6 (d) human gene promoters is shown. In both cases, cis-acting consensus sequences are represented by boxes. Control and TIA-1/TIAR-depleted HeLa cells were transiently cotransfected with PTGS2 or IL-6 promoter-driven firefly luciferase constructs together with a β-galactosidase-expressing plasmid (used as a transfection control) as described in Materials and methods. Sixteen hours after cotransfection, cells were cultured in the presence of DMSO or 20 ng/ml PMA for 6 h and assayed for luciferase and β-galactosidase activities. The represented values in (c, d) - the ratio between luciferase relative light units (RLU)/β-galactosidase activity - were normalized and are expressed relative to the control sample treated with DMSO, whose value is fixed arbitrarily to 1, and are means ± standard error of the mean (n = 3; *P < 0.001 in (c); *P < 0.01 in (d)).

