Figure 3.
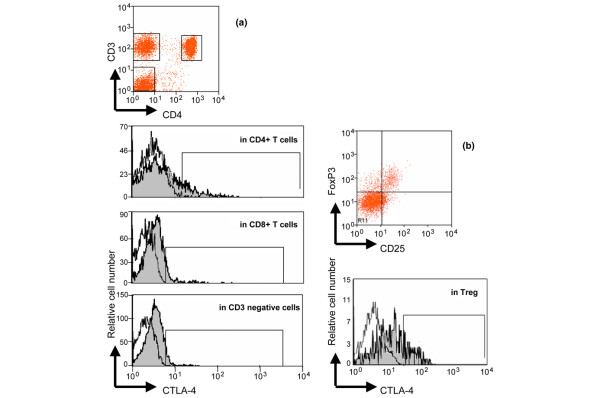
Representative analysis of intracellular Cytotoxic T Lymphocyte Antigen- 4 (CTLA-4) expression in peripheral blood lymphocyte subsets. This analysis was performed by flow cytometry as described in the Material & Methods section. (a) CD4+ T cells, CD8+ T cells and CD3- cells were identified in the PE-CY7 fluorescence vs allophycocyanin fluorescence gate based on the expression of CD3 and CD4 (CD4+ T cells, gate R6), of only CD3 (CD8+ T cells, gate R7), of neither CD3 nor CD4 (CD3- cells, gate R4). Then, intracellular expression of CTLA-4 was determined on these cell populations by comparing PE-conjugated isotype control antibody staining (open curves) with PE-conjugated anti-CD152 monoclonal antibody staining (gray filled curves). (b) Using the same gating strategy (CD3 vs CD4 dot plot), Treg were analyzed using FoxP3 vs CD25 dot plot. Intracellular CTLA-4 expression was also determined on CD3+ CD4+ CD25+ FoxP3+ cells by comparing PE-conjugated isotype control antibody staining (open curves) with PE-conjugated anti-CD152 (CTLA-4) monoclonal antibody staining (gray filled curves). The same analysis was performed for activated (CD3+ CD4+ HLA-DR+) T cells (data not shown). An example of intracellular CTLA-4 expression in CD4+ T cells, CD8+ T cells (defined as CD3+ CD4-), CD3- cells and Treg obtained with such gating strategy for a patient with spondylarthropathy is shown.

