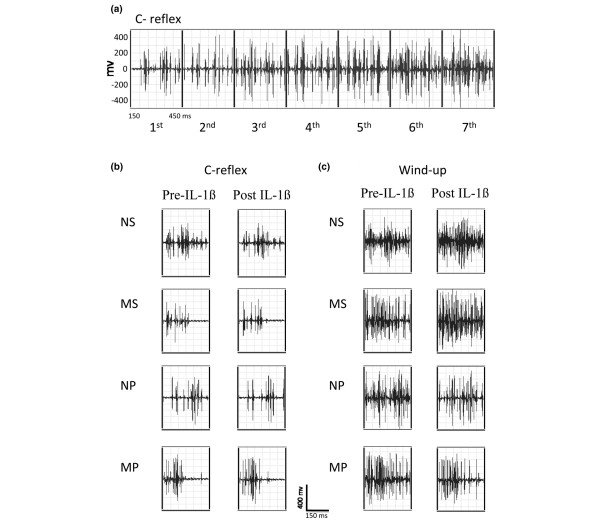
Figure 2.
Representative traces showing the effect of a stimulating train and of IL-1β on C-reflex responses. (a) Representative traces showing C-reflex potentiation (wind-up) as the stimulating train progresses from the first to the seventh stimulus number. After the seventh stimulus the potentiation reach a plateau and C-reflex response does not grow (not shown). (b) Representative traces of C-reflex responses taken from one animal per group (NS, MS, NP, and MP) showing pre-drug traces (left side) and 20 minutes post IL-β traces (right side). (c) Representative traces of potentiated C-reflex responses (wind-up) taken from one animal per group (NS, MS, NP and MP): left side = pre-drug traces; right side = 20 minutes post IL-β potentiated traces. Calibration bars are shown at the bottom. NP = normal rats receiving intrathecal propentofylline; NS = normal rats receiving intrathecal saline; MP = monoarthritic rats receiving intrathecal propentofylline; MS = monoarthritic rats receiving intrathecal saline.

