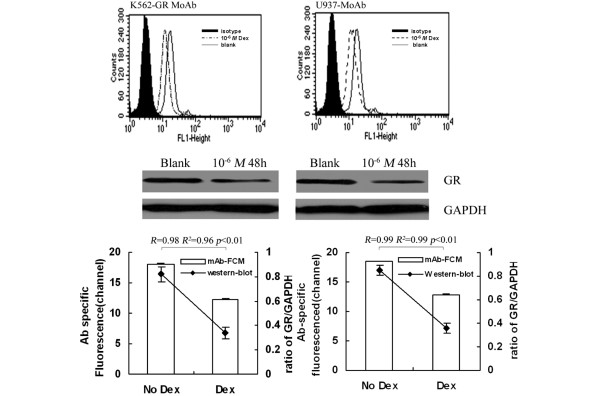
Figure 2.
Evaluation of FCM analysis of GR expression by western blot. Analysis of GR repression in (left) K562 and (right) U937 with and without 10-6 M Dex by GR-mAb FCM and western blot. Data are expressed as described in 2 figures at the bottom of Figure 2. Parallel GR-mAb FCM and western blot assays were performed on the same day, using the same cell cultures to minimise variation. Specific FCM analysis was obtained as difference of mean channel number between total and nonspecific binding. By linear regression analysis, a positive correlation between results from two methods was found. Dex = dexamethasone; FCM = flow cytometry; GR = glucocorticoid receptor; mAb = monoclonal antibody.

