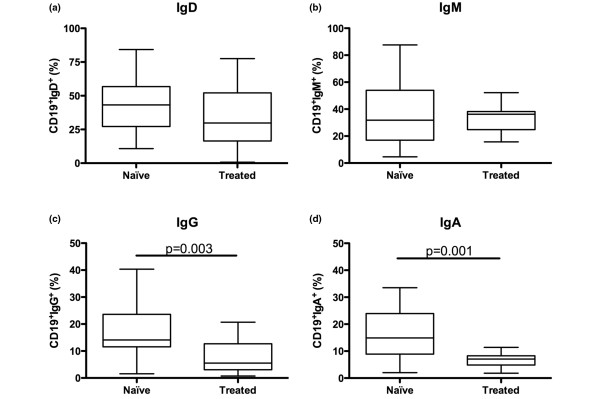
Figure 6.
Long-term changes in the immunoglobulin expression of B cells following rituximab treatment. Isolated bone marrow mononuclear cells were stained for immunoglobulin (Ig) expression comparing rituximab-naïve and treated patients. In (a) CD19+IgD+, (b) CD19+IgM+, (c) CD19+IgG+ and (d) CD19+IgA+ is shown. Box represents 25th to 75th percentile, line indicates median, whereas error bars represent range. Statistical evaluation was performed using the Mann-Whitney t-test.

