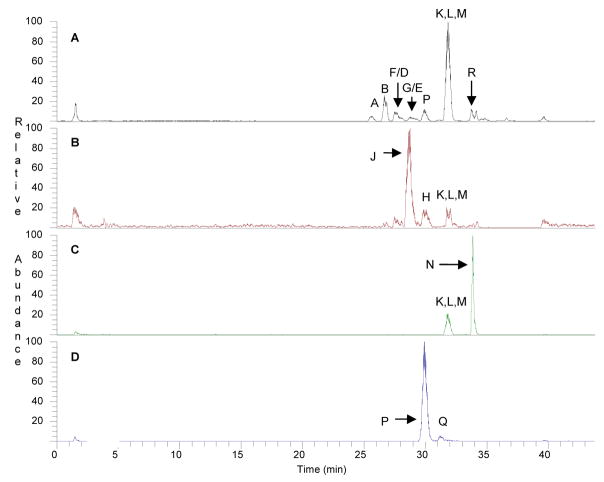
Figure 1. Characteristic chromatograms obtained by liquid chromatography-mass spectrometry analysis of an E. purpurea root extract (1:5).
Panel A shows a base peak chromatogram (plot of the most abundant ion in the mass spectrum versus time), with peak labels that correspond to the designations in Table 1. Several minor alkylamides that coelute with the compounds shown in the base peak chromatogram can be distinguished with selected ion chromatograms, as shown in panels B (mass range 245.5–246.5), C (mass range 249.5–250.5) and D (mass range 257.5–258.5).

