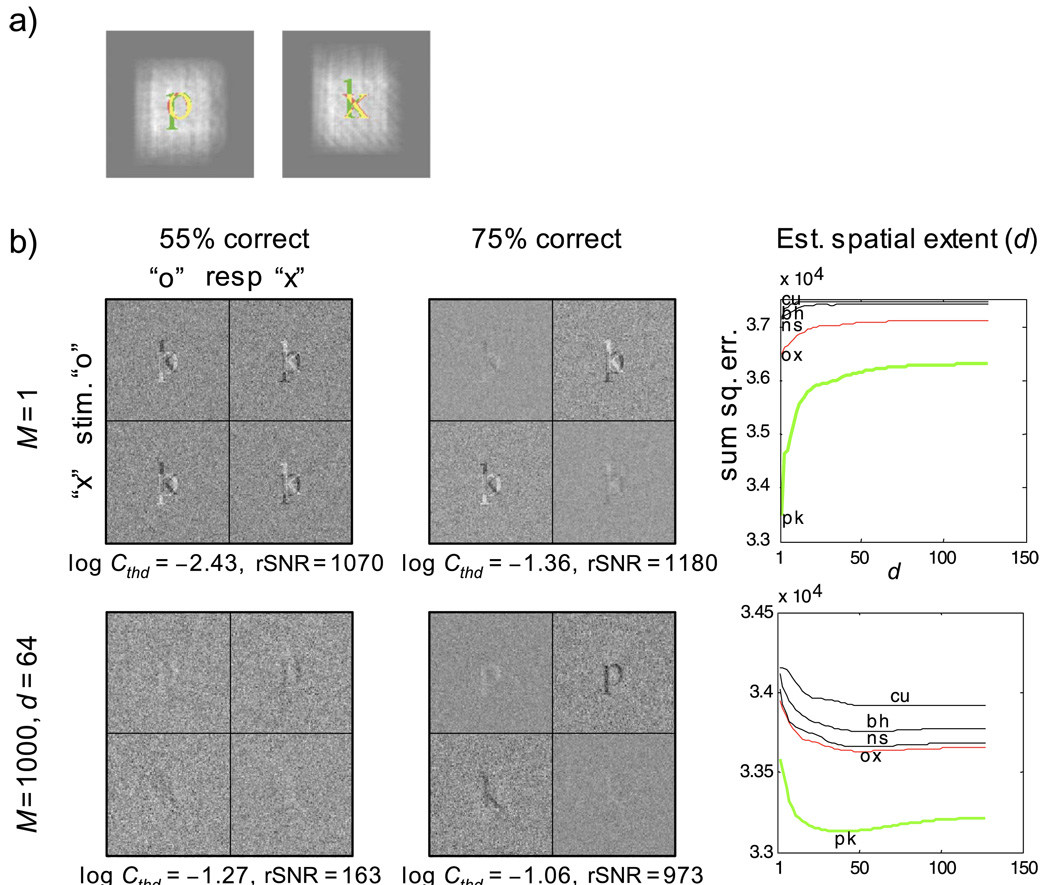
Figure 1.
(a) Signals and templates used for simulating the letter identification task using an ideal-observer model. The white haze shows the spatial extent of the intrinsic spatial uncertainty of the model for M = 1,000 and spatial extent (d) equal to 64 pixels. The templates used by the model are shown in green. The letter stimuli are shown in red and overlapping regions in yellow, (b) Classification images from the ideal-observer model for the letter identification task: first row, simulations with no spatial uncertainty (M = 1); second row, simulations with high spatial uncertainty (M = 1,000, d = 64); left column, low signal-contrast simulations at an accuracy criterion of 55% correct; middle column, high signal-contrast simulations at an accuracy criterion of 75% correct; right column, estimations of the spatial extent (d) of the uncertainty for the high signal-contrast condition (middle column)—each curve is an error function labeled by the templates used to obtain the estimate. The value of d at the minimum of each error function represents the estimated spatial extent of the uncertainty. The minimum of each curve is marked by the position of the first character of the corresponding label. The green curves were obtained using the actual observer templates from the model, the red curves were obtained using the stimuli letters as templates, and the black curves were obtained using pairs of letters that closely resembled (in terms of rms distance) the true templates. The high degree of similarity in the estimated values of d using different putative templates shows the robustness of the method. The stimulus noise had a pixel-wise standard deviation of 0.25. rSNR was computed using only the error trials, as described in Equation 26.

