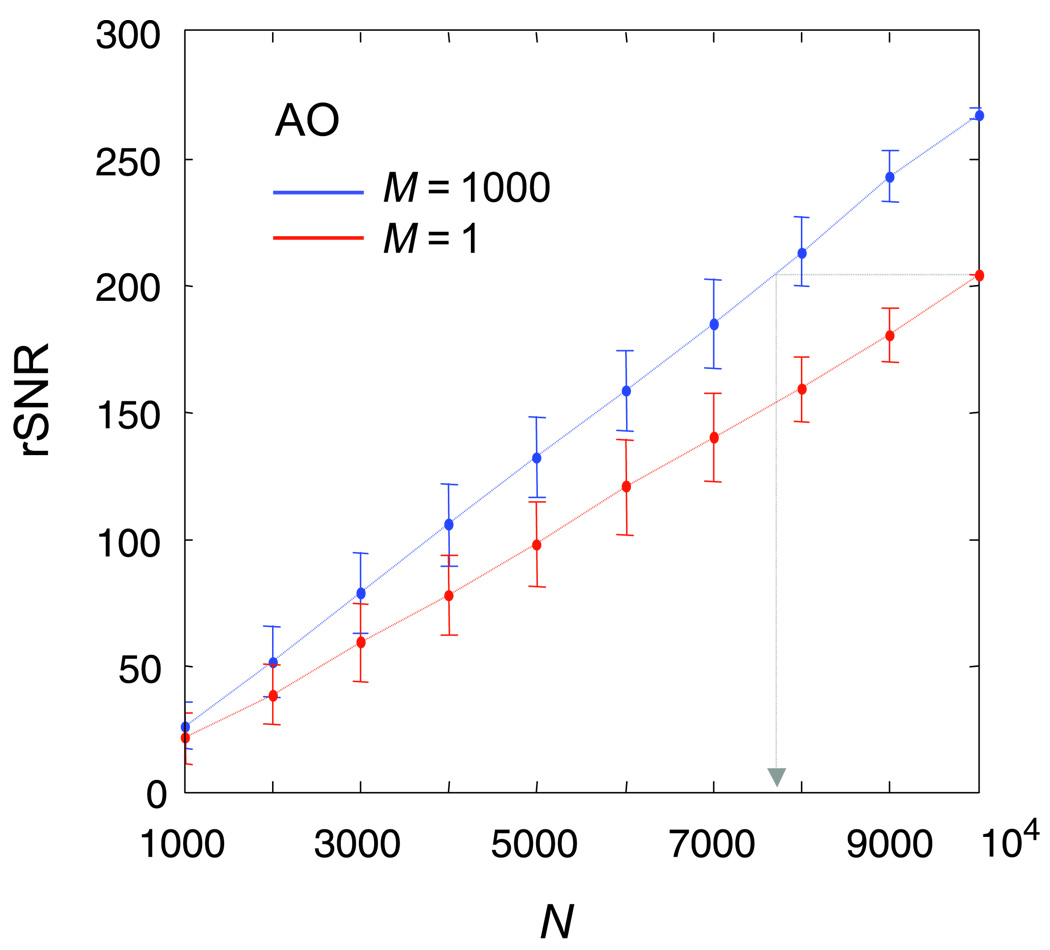
Figure 5.
rSNR versus number of trials for subject A.O. who participated in both conditions of Experiment 1. The gray arrow marks the approximate number of trials that would be needed in the high-uncertainty condition to achieve the same classification-image quality as the no-uncertainty condition. Error bars are boot-strap standard errors of the mean.

