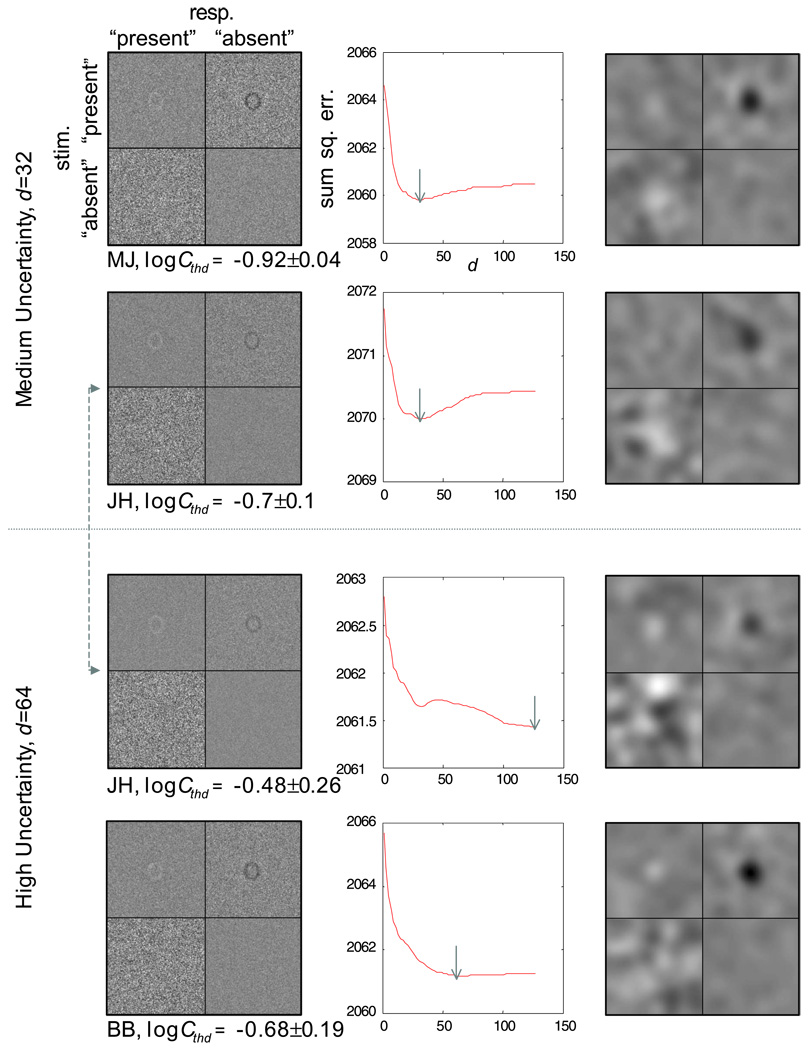
Figure 6.
Classification images for the human observers in the letter detection task (Experiment 2): top two rows, medium spatial uncertainty; bottom two rows, high spatial uncertainty; left column, classification images at a signal contrast corresponding to 75% correct; middle column, estimation of spatial extent of the uncertainty from the classifications images in the left column; the estimated value of d with the minimum residual error is marked by the gray arrows; right column, blurred versions of the classifications images in the left column using a Gaussian kernel of space constant equal to 14.1 stimulus pixels to visualize the positive haze in the false-alarm trials.

