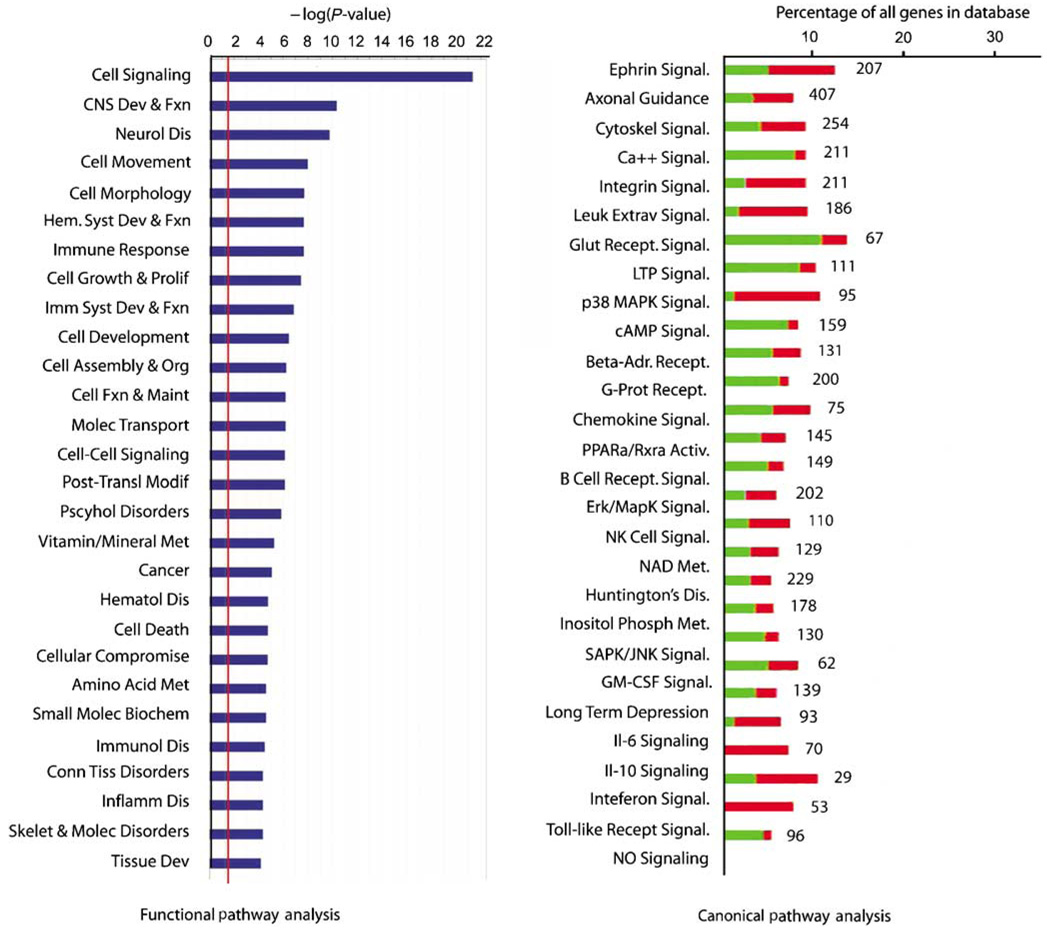
Figure 2.
Functional grouping of differentially expressed genes. The red line in the left graph indicates the threshold for a significant association, the −log(0.05). The right plot shows the percentage of genes within a canonical signaling pathway that are differentially regulated by ICH versus the total number of genes in the database for that pathway. Green indicates the number that is downregulated; red is upregulated. The number at the right of the column indicates the total number of genes for that category in the database. All of the association in the canonical signaling pathway are significant (Fisher’s exact t-test): the probability of finding the number of genes listed for each pathway as regulated in ICH out of all of the genes in the database for that pathway is greater than 0.05 for each class.

