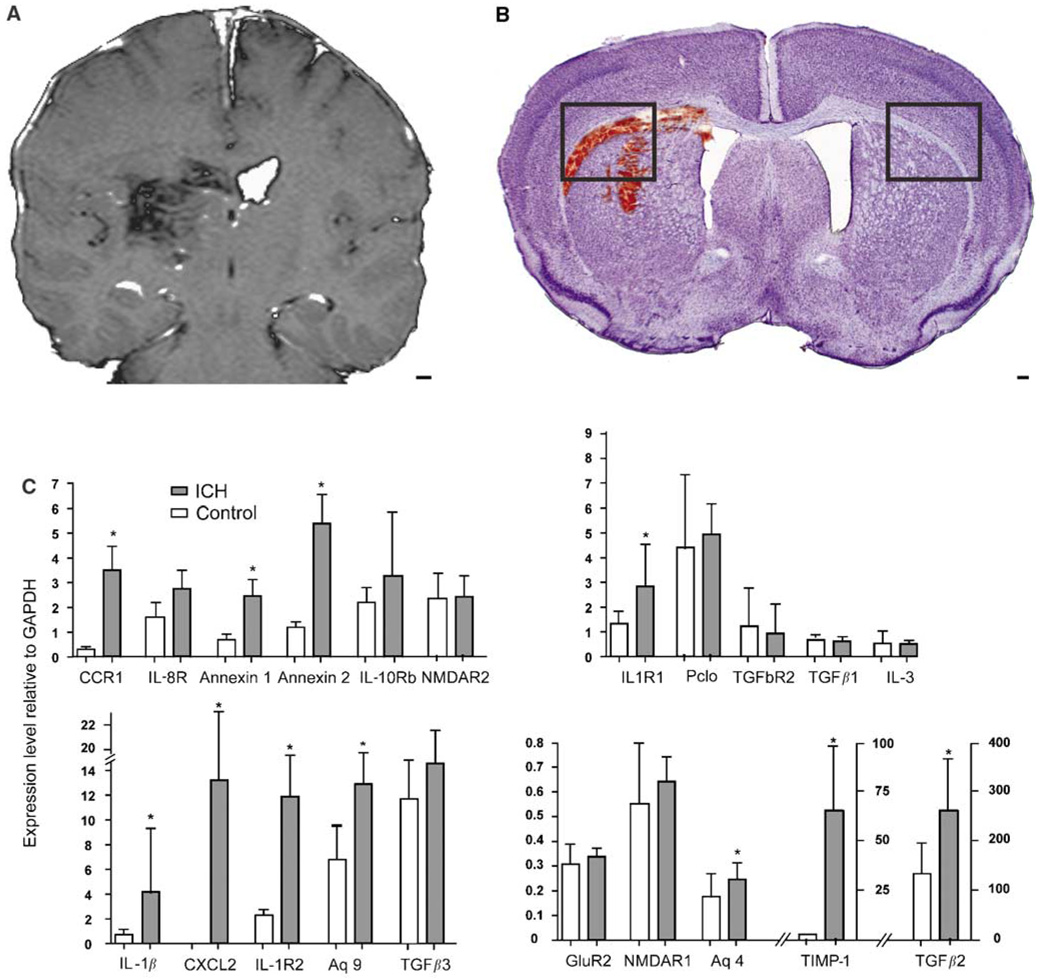
Figure 4.
Mouse ICH model and qRT-PCT testing of differentially regulated genes in human perihematomal tissue. (A) T1-weighted MRI image of human ICH case, HS6 (Table 1). (B) Nissl photomicrograph of mouse ICH model. Boxes in mouse ICH model indicate regions shown in Figures 5A and 5B. Note that the human ICH image has been contrast-enhanced to highlight the location of the hemorrhage. (C) Quantitative reverse-transcription polymerase chain reaction (qRT-PCR) results of differentially regulated genes in mouse perihematomal tissue based on human microarray experiments. *P≤0.05. Scale bar =3 mm (A); 100 µm (B).

