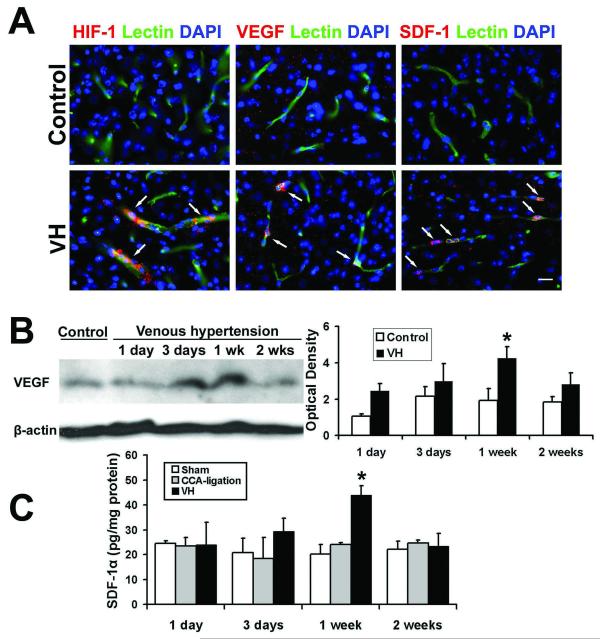
Figure 2. Increased HIF-1, VEGF and SDF-1 expression in the VH brain.
(A) Photomicrographs show that HIF-1α, VEGF or SDF-1 expression was detected in the VH brain, but not in control brains (mice with CCA ligation). The expression of HIF-1α-, VEGF- or SDF-1-positive staining was localized to the endothelial cells (lectin staining, green) in vessel walls. The nuclei were counterstained with DAPI (blue). Scale Bar =20 μm. (B) Western blot analysis shows that VEGF expression increased in the VH brain. Image at left shows a representative Western blot. Minimal expression of VEGF was observed in the control group (CCA-ligation 1 week). Bar graph at right shows that VEGF expression increased 3 days and peaked 1 week after surgery (*p<0.05, compared with the CCA-ligation group). (C) Bar graph shows the results of ELISA analysis. The expression of SDF-1α began to increase at day 3, peaked at 1 week, and decreased 2 weeks post-operation. (*p<0.05, compared with the sham and CCA-ligation group)

