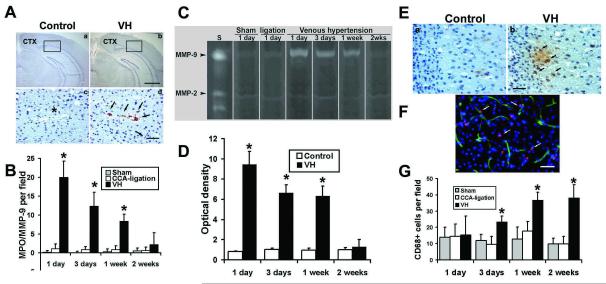
Figure 3. Increased leukocytes in the VH brain.
(A) Photomicroimage of MPO-stained sections of the brains of VH (b and d) and control (a and c) groups. One day after surgery, the MPO positive signals (brown color) increased significantly in VH brains (d), which were mainly located in the parasagittal cortex (CTX). Enlarged pictures from the selected areas (d) show that neutrophils were mainly located in the vascular wall. The nuclei were counterstained with hematoxylin. Neutrophils were absent in the brain tissue from the control groups (a and c). * in c indicates a similar-sized vessel in d. Scale bars for a and b are 1000 μm; for c and d, 50 μm. (B) Bar graph shows neutrophil counting. (*p<0.05, compared with the control group). (C) Increased expression of MMP-9 in the VH brain illustrated by gelatin zymogram gel image. S: MMP standards. Low level of MMP-9 activity was detected in the brains of control groups (Sham and CCA ligation) at day 1 after surgery. MMP-9 activity greatly increased in the VH brains day 1 after the surgery. (D) Bar graph shows the time course of MMP-9 expression. MMP-9 activity was highest at day 1 post operation, and then returned to the baseline 2 weeks after surgery. The time course of MMP-9 expression coincided with the infiltration of neutrophils. MMP-2 was expressed equally in all the groups at all time points. The control sample is from CCA-ligation group. (*p<0.05, compared with the control groups). (E) Photomicroimage shows macrophage infiltration in the parasagittal cortex of the VH brain 3 days after surgery. CD68 positive cells stained in brown color. There were few macrophages in CCA-ligation brains (a), whereas many macrophages were detected either in the vessel wall or in the parenchyma of VH brains (b). The nuclei were counterstained with hematoxylin. Scale bar = 40 μm. (F) Double fluorescence staining of CD68 (red) and Lectin (green) show that macrophage was localized in the vessel wall or in parenchyma. The nuclei were counterstained with DAPI. (G) Bar graph shows quantification of macrophages at different time points. Macrophages began to increase at day 3, and gradually increased and plateaued 1 week following surgery. The time course of macrophage infiltration coincided with increased SDF-1 expression. (*p<0.05, compared with the sham or ligation group)

