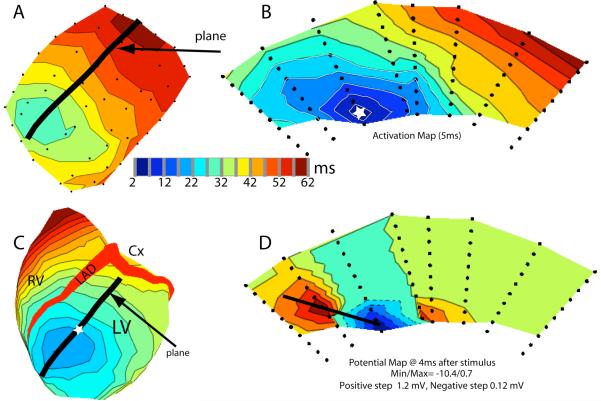
Figure 13.
A) Epicardial isochronal map recorded from the outermost electrodes from 55 needles (black dots) following subendocardial stimulation. Black line indicates the epicardial intersection of the transmural plane depicted in panels B and D. B) Isochronal map after same subendocardial stimulation (white star). C) Isochronal map recorded from 242 sock electrodes on the epicardial surface. White star indicates site of insertion of needle used for subendocardial stimulation. Here again, heavy black line indicates transmural plane in panels B and D. D) Isopotential map recorded during the same subendocardial stimulation. Dashed lines indicate negative potentials and solid lines are positive potentials.

