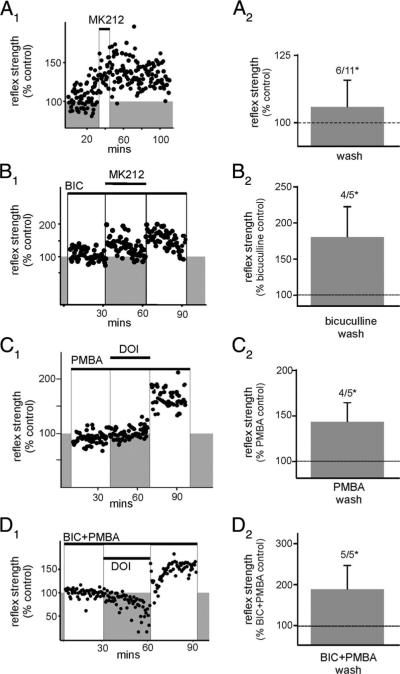
Fig. 4.
Blocking inhibitory synaptic transmission is not essential for the induction of LLFR. Stimuli were delivered at 500 μA, 500 μs, 0.03 Hz. A: activation of 5-HT2C receptors with the partial agonist 6-chloro-2-(1-piperazinyl) pyrazine (MK212) induces a weak LLFR. A1: individual experiment demonstrating the most robust LLFR observed after MK212 application. y-axis represents the reflex strength normalized to 100%. A2: mean percentage change in reflex strength after MK212 washout (n = 11), expressed as a percentage of control. LLFR was observed in 6/11 cases, P < 0.05. B: after the block of GABAA receptors with bicuculline, a profound increase in reflex facilitation after washout of MK212 is observed. B1: individual experiment demonstrating MK212-induced LLFR while in the presence of bicuculline (compare episodes in white boxed regions). B2: mean percentage change in reflex strength after MK212 washout but still in the presence of bicuculline, expressed as a percentage of bicuculline control (LLFR in 4/5, P < 0.05). C: DOI is capable of inducing LLFR during block of glycine receptors with phenylbenzene-ωphosphono-α-amino acid (PMBA). C1: individual experiment demonstrating DOI-induced LLFR while in the presence of PMBA (compare white boxes). C2: mean percentage change in reflex strength after DOI washout but still in the presence of PMBA, expressed as a percentage of PMBA control (LLFR in 4/5, P < 0.05). D: DOI induces LLFR during simultaneous blockade of both GABAA and glycine receptors. D1: individual experiment demonstrating DOI-induced LLFR in the presence of both bicuculline and PMBA (compare white boxes). D2: mean percentage change in reflex strength after DOI washout but still in the presence of bicuculline + PMBA, expressed as a percentage of bicuculline + PMBA control (LLFR in 5/5, P < 0.05). LLFR in these and all other figures was determined by comparing control to washout with a paired t-test, stimulation was applied at 500 μA, 500 μs and the first 100 ms after stimulation artifact were quantified as described in METHODS.

