
Fig 1.
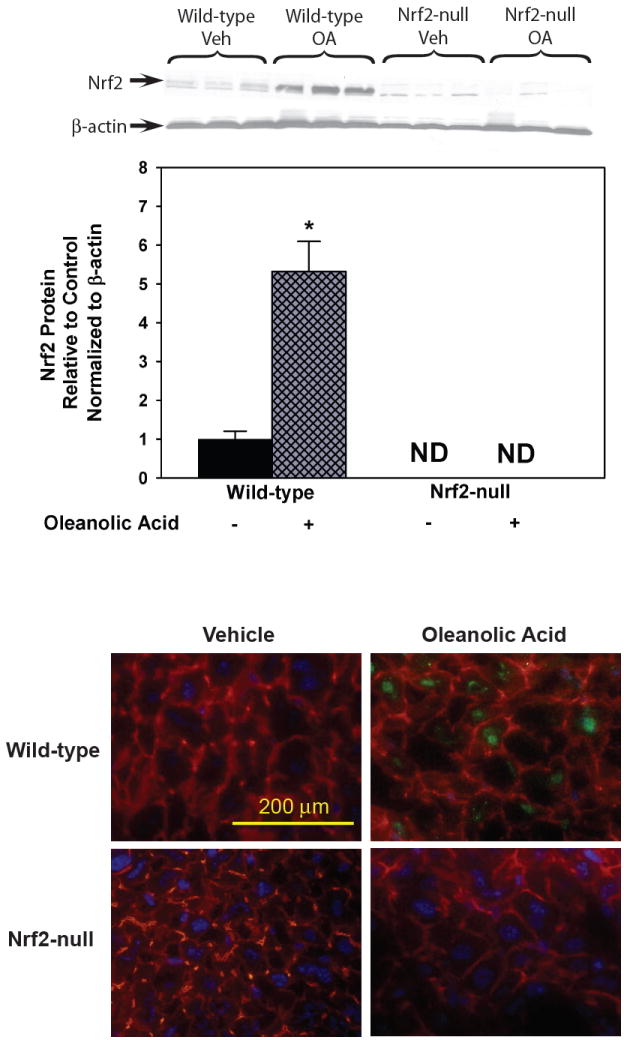
Upper. Western blot of liver nuclear fractions for Nrf2 after treatment with oleanolic acid (90 mg/kg, i.p.) once daily for three days. Also shown is the quantification of specific band intensity, normalized to β-actin, and expressed relative to control as mean ± S.E.M. Abbreviations: ND, Not Detected; Veh, Vehicle; OA, oleanolic acid; WT, wild-type; null, Nrf2-null. Asterisks (*) indicate a statistically significant difference from wild-type mice treated with vehicle (p ≤ 0.05). Lower. Immunofluorescent localization of Nrf2 in livers from wild-type mice after vehicle or oleanolic acid. Indirect immunofluorescence to detect Nrf2 (green) and actin (red) was performed on liver cryosections (5 μm) from wild-type mice after oleanolic acid (90 mg/kg, i.p.) treatment once daily for three days. Sections were mounted in Prolong Gold containing DAPI for nuclear staining (blue). Representative images are shown at high-power magnification (×400). Bar represents 200 μm.