
Fig 2.
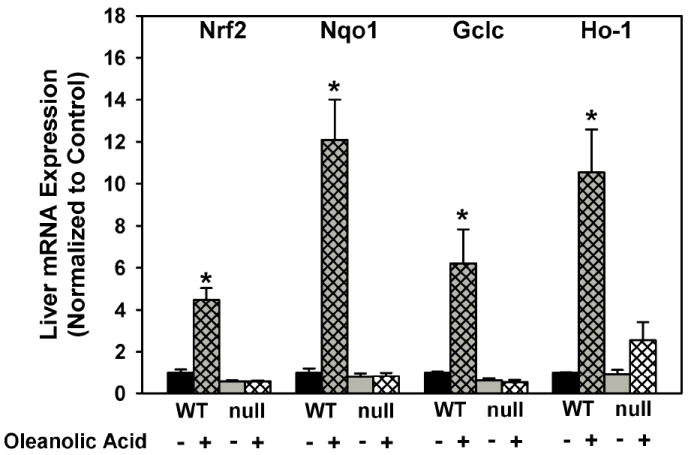
Messenger RNA expression of Nqo1, Gclc, and Ho-1 in livers of wild-type and Nrf2-null mice after treatment with oleanolic acid (90 mg/kg, i.p.) once daily for three days. Messenger RNA was quantified by the bDNA assay. Data is expressed relative to wild-type controls as mean ± S.E.M. Abbreviations: WT, wild-type; null, Nrf2-null. Asterisks (*) indicate a statistically significant difference from wild-type mice receiving vehicle (p ≤ 0.05).