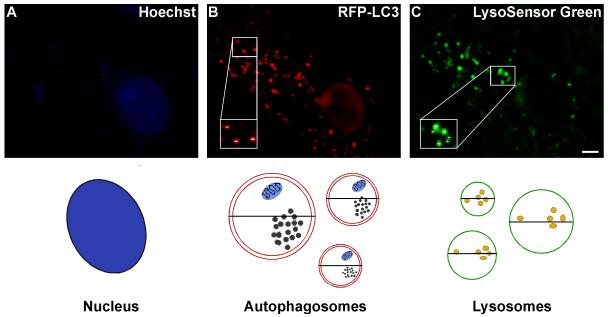
Figure 2. Schematic for measuring the size of autophagy-positive vacuoles.
Autophagosome and lysosome vacuole size are quantified by measuring the diameters of all visible RFP-LC3- and LysoSensor Green-positive vacuoles. At least 7 images are collected via live cell microscopy per treatment. Using the Slidebook magnification tool, images are increased in size so that the diameter (μm) of each vacuole can be easily measured using the ruler tool. The diameters of all visible vacuoles in 7-12 Purkinje neurons per treatment are measured, which reflects diameter measurements of ∼200 vacuoles per treatment. The total number of vacuoles are then counted and categorized as small (<0.75), medium (0.75-1.5) large (1.5-2.25) or extra large (>2.25) based on their diameter, and the size distribution is graphed as percent of total vacuoles within the indicated size ranges. Images shown represent a 6 hr treatment of cerebellar cultures in TFW medium. Scale bar represents, 5 μm.

