
Figure 2.
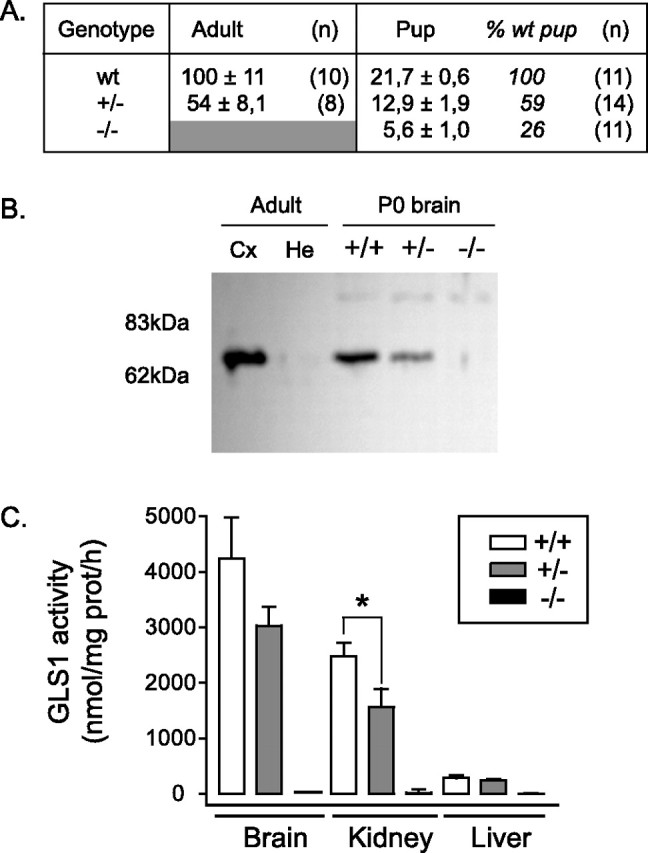
GLS1 expression and activity in neonates. A, Quantitative RT-PCR determination of GLS1 expression. mRNA expression level was normalized to the mean of adult wild-type brain (141.8 ± 16, with respect to actin, which was set to 1000) and expressed as a percentage (mean ± SEM). Samples were taken from young adult (1- to 2-month-old) and late-gestation fetuses and reported for WT, heterozygous mutants (+/−), and nulls (−/−). A further normalization to fetal brain is shown in italics. GLS1 expression was reduced in the mutants. B, Western blot analysis using anti-GLS1 antibody. Adult brain tissues show a ∼65 kDa specific band in Cx and no signal in He. For newborn brain (P0), the intensity of specific signal was strongly reduced in heterozygous (+/−) compared with wild-type tissues (+/+), and no signal was detected in null tissues (−/−), despite the fact that five times more protein was loaded on the gel. C, GLS1 activity. Enzymatic GLS1 activity assay was measured in newborn tissues (brain, kidney, and liver). In GLS1 heterozygous pups, reduced activity was observed in the kidney (∗p < 0.005), but activity in the brain and liver was not significantly different from WT pups. No GLS1 activity was detectable in GLS1 null tissues. Error bars represent SEM.