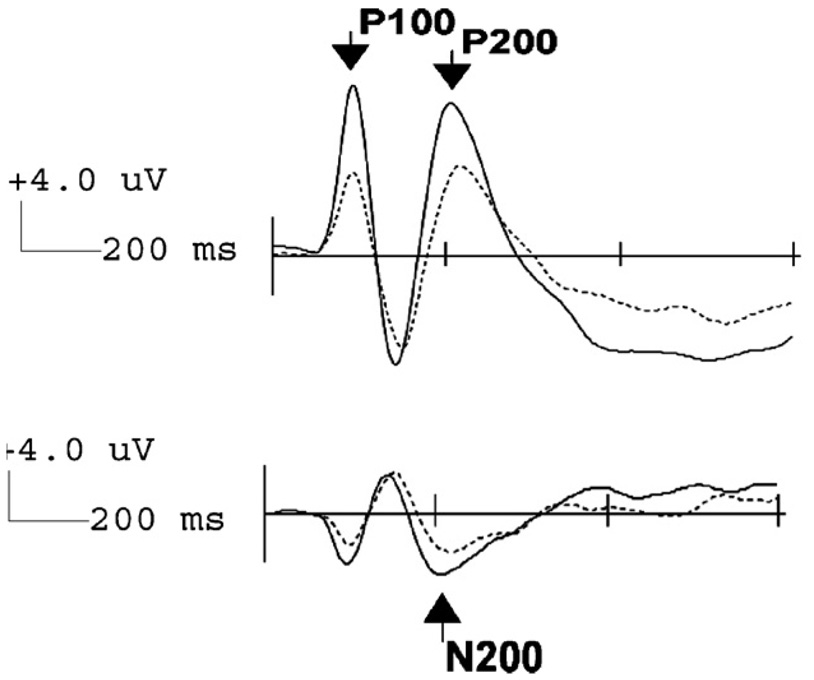
Fig. 5.
Grand-averaged ERP responses for high (solid line) vs. low (dashed line) BIS groups across all emotions for the P100 and P200 components (right posterior electrode PO8; top panel) and for N200 (right anterior electrode FC4; bottom panel). The amplitudes of these components were most pronounced in the high vs. low BIS group.

