
Figure 3.
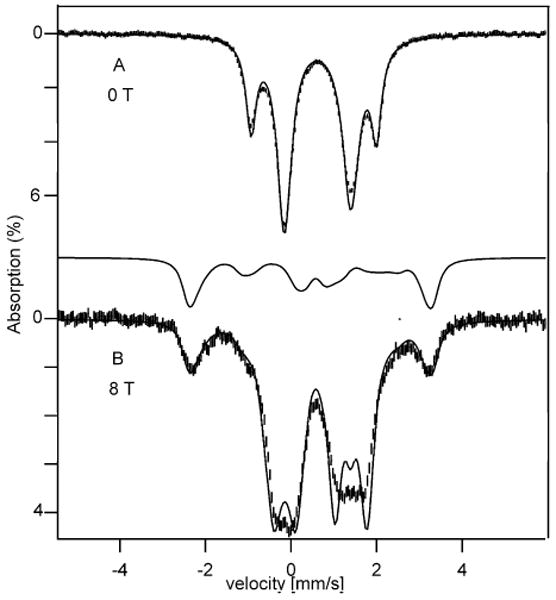
100 K Mössbauer spectra of complex 1 recorded in zero field (A) and an 8.0 T field applied parallel to the γ beam (B). The solid lines are simulations using the parameters quoted in Table 1.
Official websites use .gov
A
.gov website belongs to an official
government organization in the United States.
Secure .gov websites use HTTPS
A lock (
) or https:// means you've safely
connected to the .gov website. Share sensitive
information only on official, secure websites.
100 K Mössbauer spectra of complex 1 recorded in zero field (A) and an 8.0 T field applied parallel to the γ beam (B). The solid lines are simulations using the parameters quoted in Table 1.