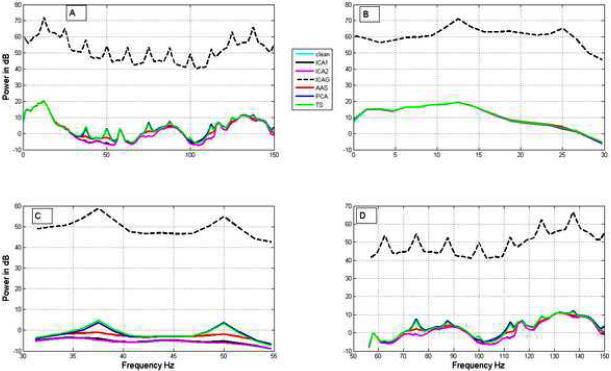
Figure 5.
Comparison of actual and estimated power spectra for the simulated EEG data. Panels A, B, C and D respectively show the power spectra in the frequency ranges 0-200 Hz, 0-30 Hz (up to beta band), 30-55 Hz (gamma) and 55-150 Hz (high gamma). The performance of ICA1 and ICA2 are better in all the frequency ranges. ICA based methods perform better than the other methods. Refer to Table 2A for details.

