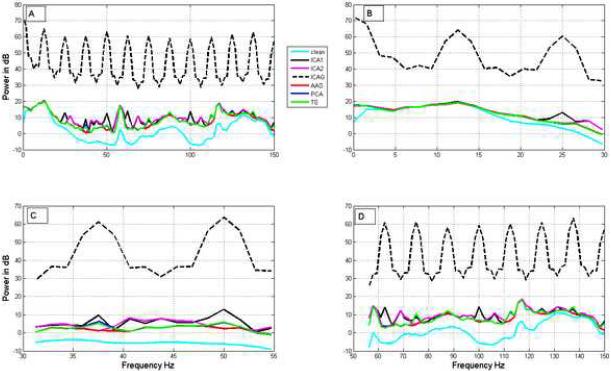
Figure 6.
Comparison of the actual and estimated power spectra for the phantom data. Panels A, B, C and D respectively show the power spectra in the frequency ranges 0-200 Hz, 0-30 Hz (up to beta band), 30-55 Hz (gamma) and 55-150 Hz (high gamma). All methods except ICA3 perform well in the frequency range 0-30 Hz shown in B. All methods perform poorly in the gamma and high-gamma bands. The performance of our ICA methods is marginally better with respect to the obtained SNR in most of the frequency bands up to beta band (Table 2C).

