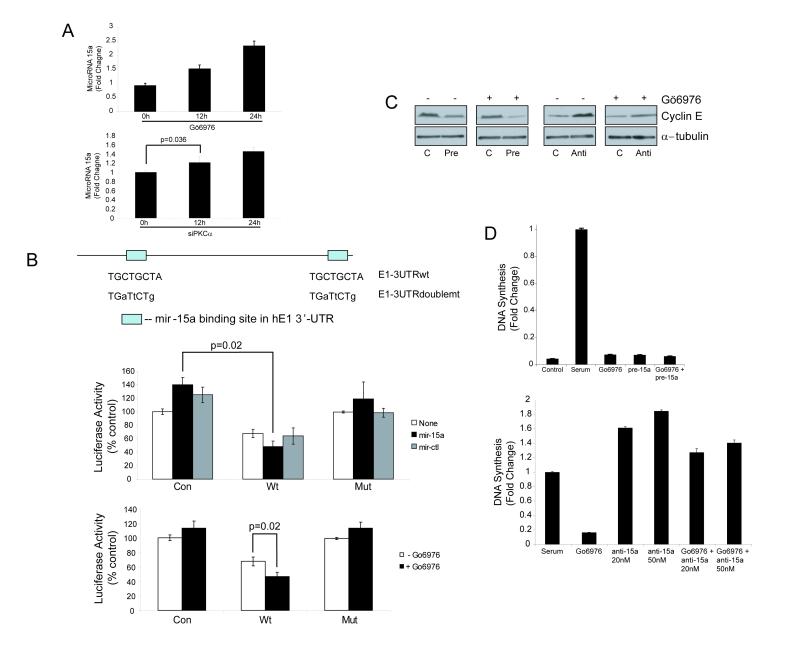
Figure 4. PKC alpha regulates cyclin E expression and DNA synthesis through miR-15a.
A) Detection of mature miR-15a expression in SQ20B cells by quantitative real-time PCR. SQ20B cells were untreated or treated with Gö6976 (100nM, top panel) or PKCα siRNA (bottom panel) for 12 and 24 hours. After miRNA extraction, qRT-PCR was performed in triplicate as described in Experimental Procedures. Bars represent relative miRNA levels +/- S.E normalized to no treatment. B) miR-15 and PKCα regulate protein synthesis via miR-15 binding sites in the 3′UTR of cyclin E. SQ20B cells were transfected with a luciferase reporter expressed in conjunction with control vector (Con), wild type (Wt) 3′ UTR of cyclin E or doubly mutated (Mut) 3′ UTR of cyclin E. The reporter-expressing cells were either transfected with pre-miR-15a or control vector (middle panel), or pretreated with Gö6976 (100 nM) for 24 hrs (lower panel). The upper panel shows the sites of miR-15a binding in the 3′UTR of cyclin E and the mutations that were introduced. P values were determined using 2-tailed Student’s T-test. C) Effect of pre-miR-15a and anti-miR-15a on cyclin E levels in the absence or presence of Gö6976. SQ20B cells were transfected with 20 nM of pre-miR-15a (Pre), 50 nM of anti-miR-15a (anti), or control precursor (C) and treated (+) or untreated (-) with Gö6976 (100 nM) for 24 hrs. Cyclin E level was determined by protein immunoblotting. Each blot of paired lanes represents an independent experiment and was not performed simultaneously with the others. D) Effect of miR-15a and anti-miR-15a on DNA synthesis. Top panel: SQ20B cells were transfected with either 20 nM of control precursor or pre-miR-15a RNA by electroporation. Cells were grown in serum-free medium (control) or serum containing medium (all others) and exposed to Gö6976 (100 nM), pre-miR-15a miRNA (pre15a), or both. BrdU incorporation was quantified and expressed as fold change normalized to serum. Bottom panel: SQ20B cells were transfected with 20 nM or 50 nM of anti-miR-15a or Gö6976 (100 nM) and grown in serum containing medium. BrdU incorporation assays were performed and levels were expressed as fold change normalized to serum. All BrdU incorporation results are the mean +/- S.E. of three independent experiments.

