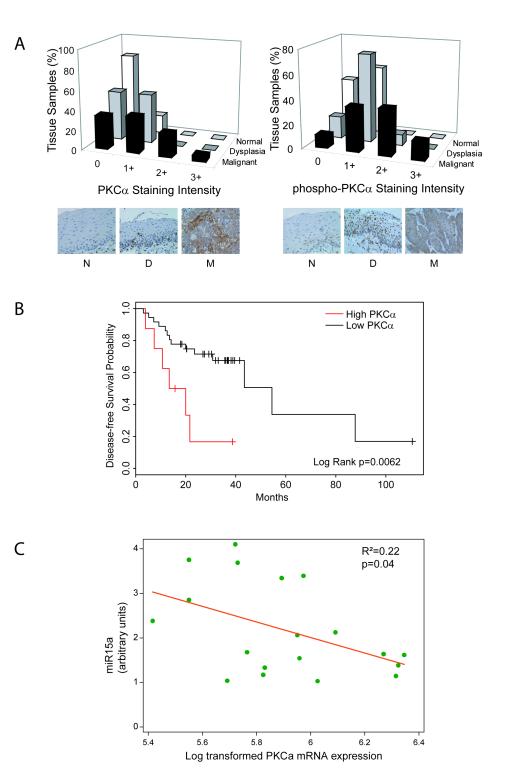
Figure 5. Tissue expression of total and phosphorylated PKC alpha and association of PKC alpha gene expression with miR-15a expression and tumor recurrence.
A) Left panel: Proportion of normal, dysplastic, or malignant specimens classified by staining intensity with anti-PKCα antibody. Representative sections of normal (N), dysplastic (D) and malignant (M) tissue sections stained with anti-PKCα antibody. Right panel: Proportion of normal, dysplastic, or malignant specimens classified by staining intensity with anti-phospho-PKCα antibody. Representative sections of normal (N), dysplastic (D), and malignant (M) tissue sections stained with anti-phospho-PKCα antibody. Staining intensity is expressed on a 4-point scale from 0 to 3+ (see Experimental Procedures). B) Kaplan-Meier curve of disease-free survival probability as a function of high (red) versus low (black) PKCα gene expression by Affymetrix array. Statistical significance was determined by the log rank test. C) PKCα transcript and miR-15a levels inversely correlate in individual SCCHN tumor samples (R2=0.22). mRNA and miRNA were isolated from 19 SCCHN tumor samples and analyzed for expression of PKCα transcripts and miR-15a by RT-PCR as described in Experimental Procedures. The results were plotted and analyzed by linear regression analysis for an inverse correlation. The p value reveals statistical significance.

