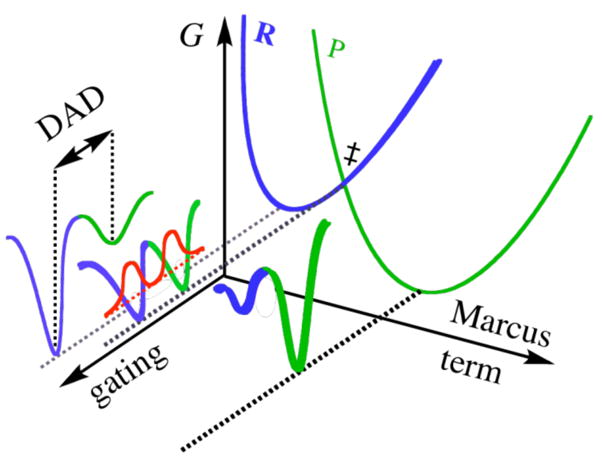
Figure 1.

An illustration of a Marcus-like model. The “Marcus-term” axis indicates motions that carry the system to the TRC (‡). The “gating” axis indicates the fluctuations of the DAD. R and P are the reactant and product potential energy surfaces, respectively. The red curves show the wavefunctions of the hydrogen nucleus. Reproduced with permission from Willy.19
