
Figure 6.
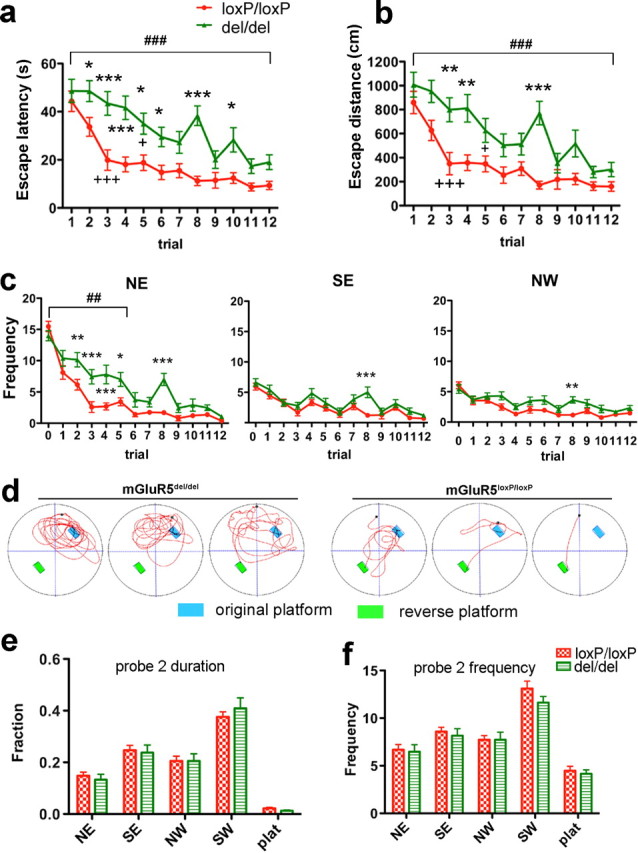
Ablation of mGluR5 caused a significant deficit in performance of the reversal task of the MWM. a, b, Trial-by-trial analysis of escape times (a) and path lengths (b) taken to reach the hidden platform at a reversed position. Two-way ANOVA analysis of escape duration showed significant effect for genotype group (F (1,396) = 45.68, p < 0.0001), trial (F (11,396) = 18.39, p < 0.0001) and trial–genotype interaction (F (11,396) = 1.99, p = 0.0284). Dunnett's multiple comparison test comparing to trial #1 showed that the improvement in mGluR5loxP/loxP mice reached significant difference at trial #3 (+++ p < 0.001), The improvement in mGluR5del/del group became significant on fifth trial (+ p < 0.05). Two-way ANOVA analysis of path lengths also showed significant effect for genotype group (F (1,396) = 35.52, p < 0.0001), trial (F (11, 395) = 15.85, p < 0.0001) and trial–genotype interaction (F (11,396) = 1.95, p = 0.0322). Dunnett's multiple comparison test showed that the improvement reached significant difference on trial #3 (+++ p < 0.001) for mGluR5del/del mice and fifth trial (+ p < 0.05) for mGluR5loxP/loxP mice, respectively. Bonferroni posttests used to compare individual points between genotype groups detected significant differences in escape latency and distance as early as trial 2 and trial 3 (mGluR5del/del, n = 19; mGluR5loxP/loxP, n = 19). c, Throughout training, mGluR5del/del mice entered the NE quadrant (previous target location) more often then the control group (F (1,180) = 11.70, p = 0.0016, for genotype, trial 0–5; F (5,180) = 3.88, p = 0.0023, for genotype–trial interaction, trial 0–5) (left). Meanwhile, entries to SE quadrant (trial 0–5, genotype effect: F (1,180) = 2.90, p = 0.097, genotype–trial interaction: F (5,180) = 0.45, p = 0.8164) and NW quadrant (F (1,180) = 4.29, p = 0.0455 for genotype; F (5,180) = 1.44, p = 0.2116 for genotype–trial interaction) were much lower for the mGluR5del/del mice, and were more comparable to the control group. Trial 0 represents frequencies entered in each testing zone during probe test 1 from the same group of animals (mGluR5del/del, n = 19; mGluR5loxP/loxP, n = 19). Due to an unknown reason, mGluR5del/del mice performed poorly in trial 8. They had much longer escape latency (Fig. 6 a) and distance (Fig. 6 b) than the control group. Their longer search in trial 8 also resulted in much higher number of entries into all quadrants compared with the control group. d, Representative trajectories taken from trial 2, demonstrating that mGluR5del/del mice continued to return to the previous target location while control mice more rapidly found the new location. e, f, Second probe test performed 7 d after reversed platform training. Both groups remembered the last target location (SW) (F (4,144) = 59.61, p < 0.0001 for time spent in the different quadrants; F (4,144) = 52.54, p < 0.0001 for number of entries). There was no significant genotype–quadrant interaction for time spent (F (4,144) = 0.29, p = 0.8815) (e) and entry numbers (F (4, 144) = 0.50, p = 0.7369) (f). Data are presented as SEM (*p < 0.05, **p < 0.01, ***p < 0.001 for Bonferroni posttests; ## p < 0.01, ### p < 0.001 for two-way ANOVA; + p < 0.05, +++ p < 0.001 for Dunnett's multiple comparison test).