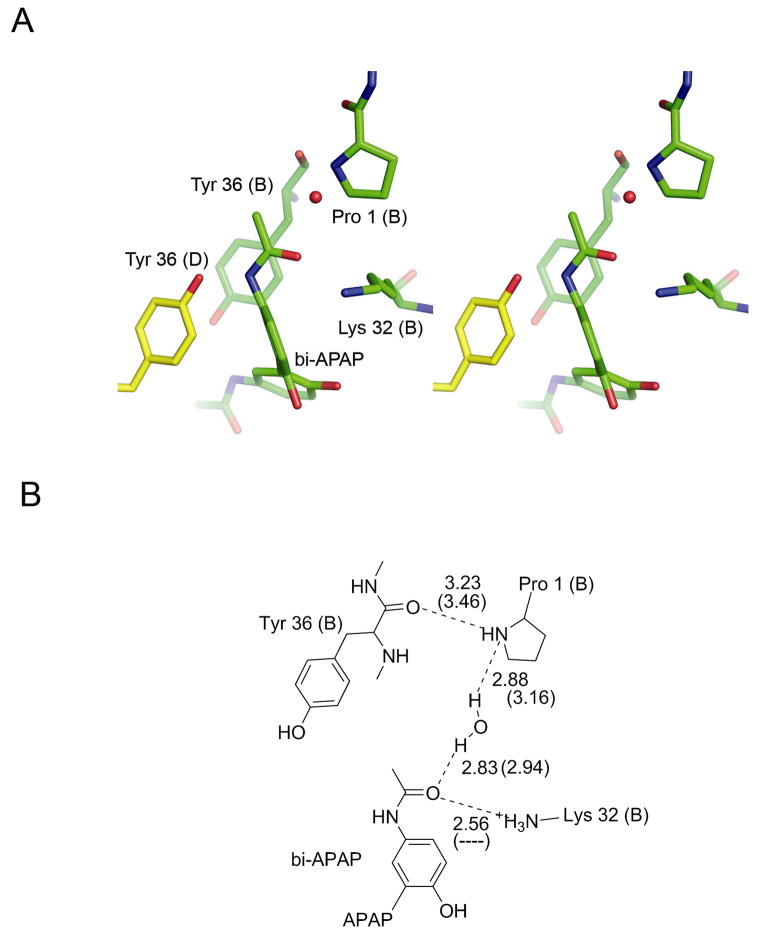
Figure 3.
Interactions of bi-APAP with active site residues. A. Three-dimensional stereo view of interactions in active site B. The interactions in active site D are similar, but not quite as strong. B. Schematic representation of active site hydrogen bonding. Hydrogen bonds are labeled with the gdistances between non-hydrogen atoms as found in active site B with the distances in active site D in parentheses. Distances are in Ångstroms. Lys 32 in subunit D is not positioned to have a good angle for hydrogen bonding; this lack of a hydrogen bond is noted by a dashed line.

