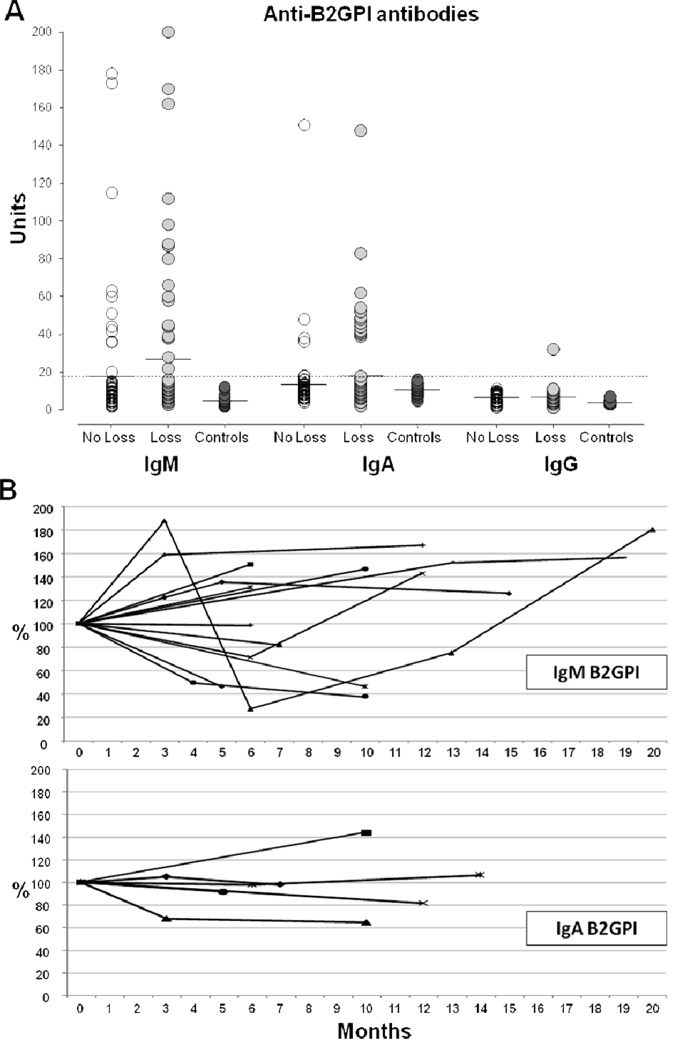
Figure 1.
A, Serum levels of IgM, IgA and IgG anti-B2GPI antibodies in SSc patients with (n=75) or without (n=75) digital loss and healthy controls (n=20). The horizontal bars indicate the mean values. The dotted line shows the cut-off value. B, Relative variation of IgM and IgA anti-B2GPI antibody titers from baseline (defined as 100%) over time (months). Each line represents a study patient for whom serial serum samples were available (IgM n=16 and IgA n =6).

