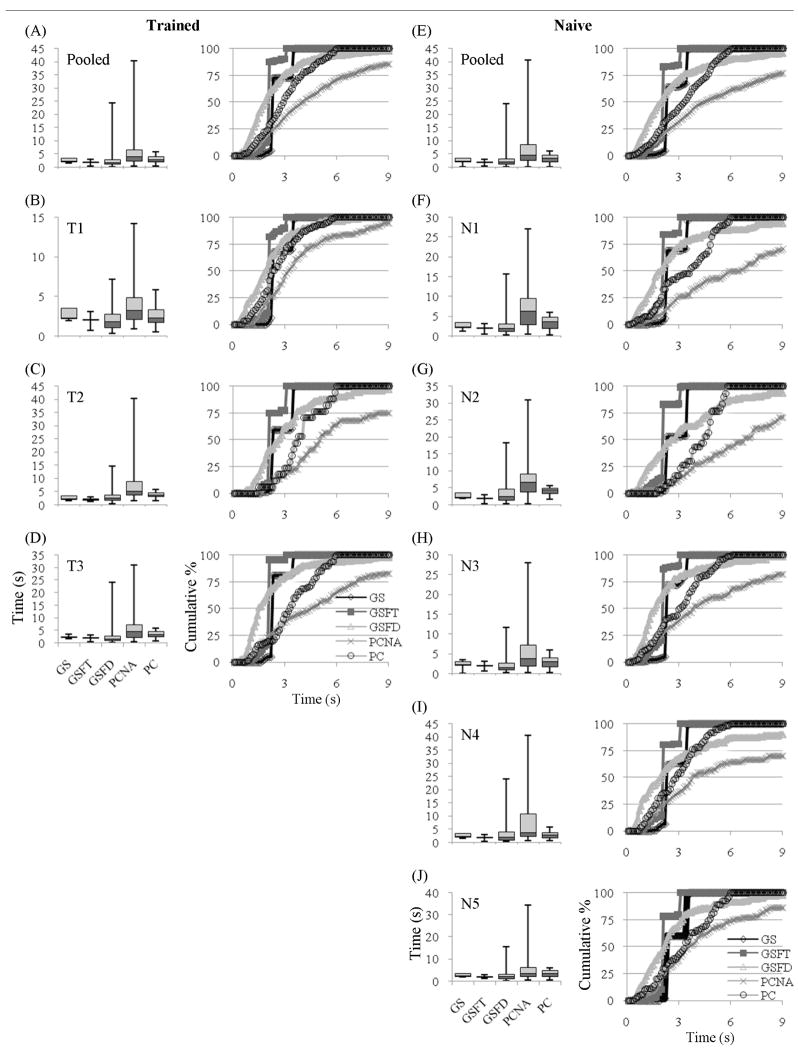
Figure 3.
Time required for a hit across the five paradigms for trained ((A) through (D)) and naive ((E) through (J)) subjects. The goal selection paradigms are faster than the process control paradigms. Axes labels and graph legends on the bottom row of each column ((D) and (J)) apply to all figures in that column. The plots to the right of each box plot are the same data, shown as a cumulative distribution.

