Figure 3.

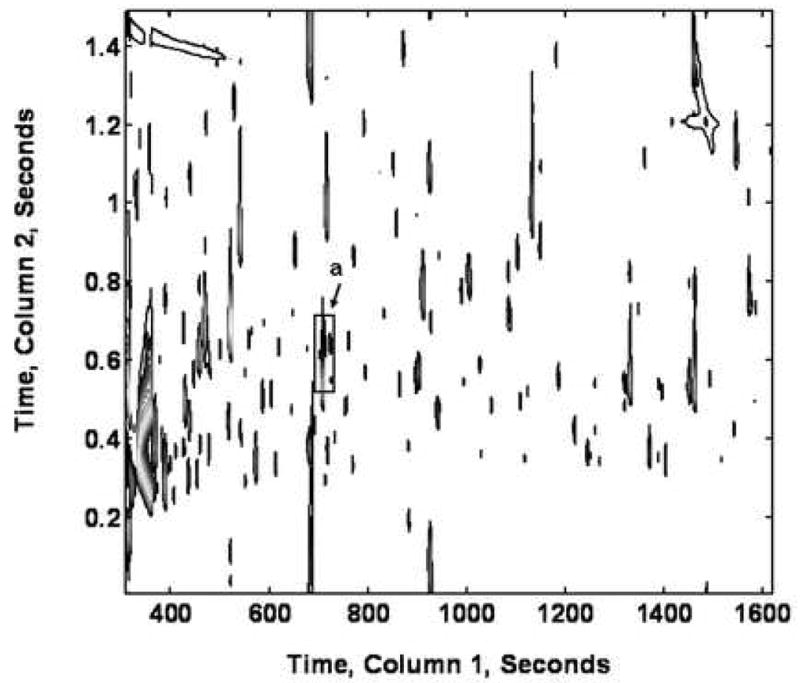
TIC contour plot of an ethylamine culture extract analyzed by GC × GC-TOF-MS as methoximed and trimethylsilylated derivatives. The box region (a) was identified as glycine (column 1, 714 s and column 2, 0.62 s).

TIC contour plot of an ethylamine culture extract analyzed by GC × GC-TOF-MS as methoximed and trimethylsilylated derivatives. The box region (a) was identified as glycine (column 1, 714 s and column 2, 0.62 s).