Figure 4.


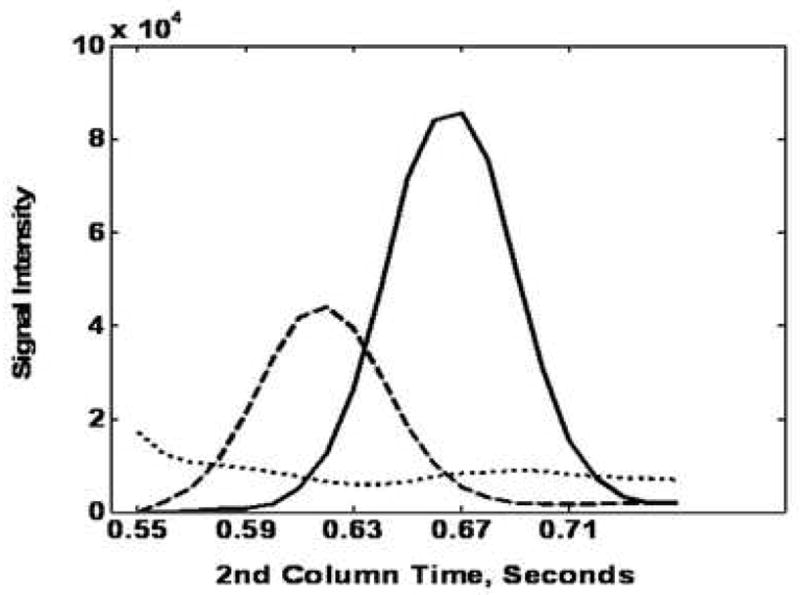
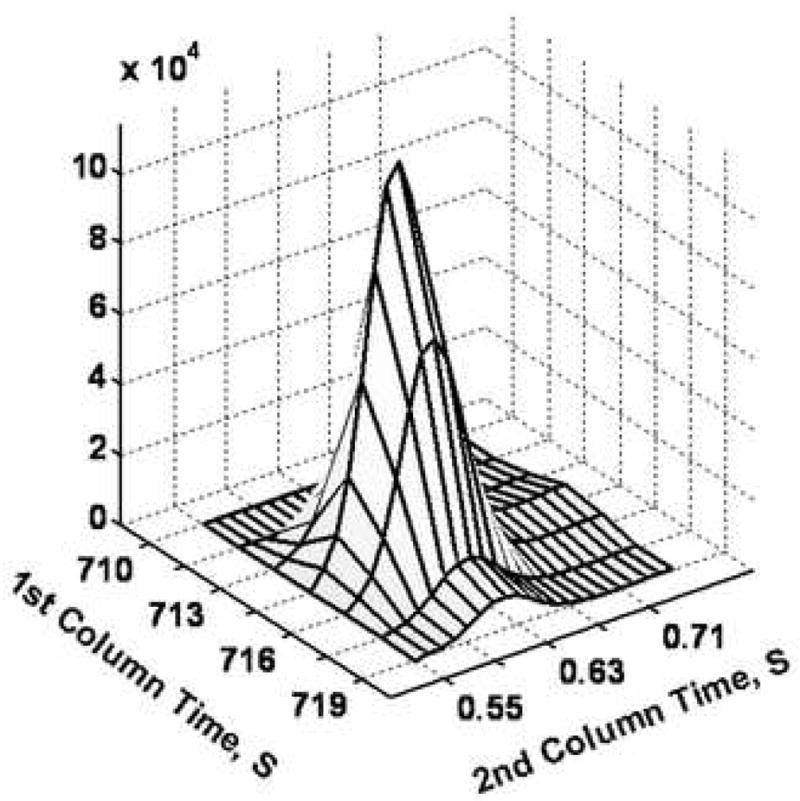
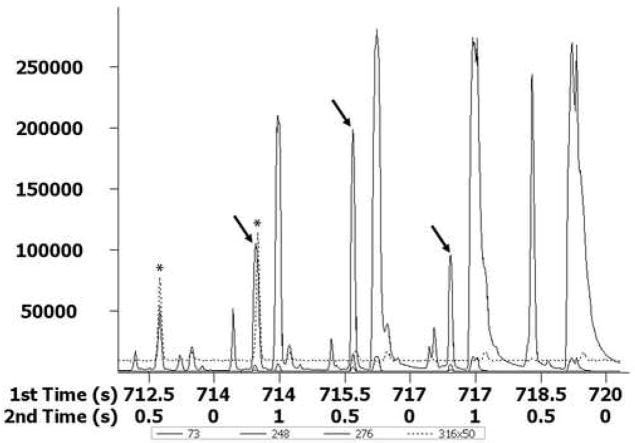
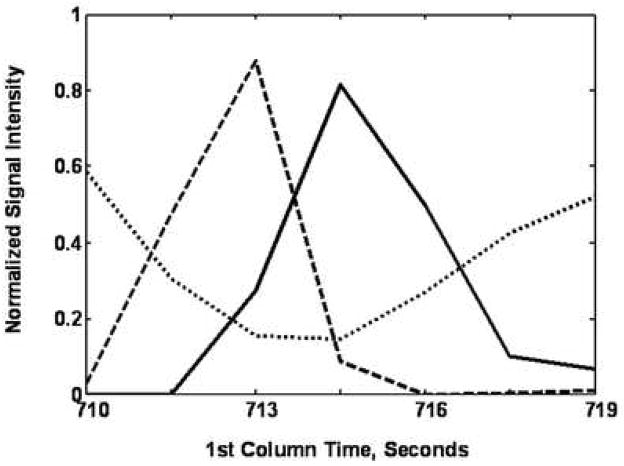
Demonstration of using PARAFAC for the quantification of a peak that was partially separated by the 2D separation (GC × GC-TOF-MS). (A) Raw data (vector) plot of the boxed region (a) in Figure 3 at mass channels (m/z) 73, 248, 276 and 316. The peaks (mass channels, 73, 248 and 276) with the arrows on top were identified as glycine, tri-TMS. The peaks (mass channel, 316) with the stars on top were overlapping component. (B) Column 1 profiles with glycine (solid line). (C) Column 2 profiles, with glycine (solid line). (D) 3D reconstruction of the glycine peak, obtained by taking the cross product of the column 1 and column 2 peak profiles for glycine from (B) and (C).


